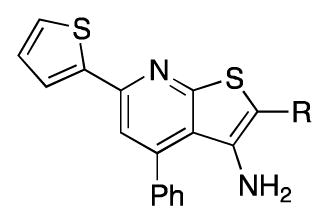
Table 1.
Structure-Activity Relationship for Sulfoxide Side Chain.

| |||||
|---|---|---|---|---|---|
| Compound | R | IC50 (nM) | Fold PGE2 increase at | Aq. Solubility (μg/mL)a,b | |
| 20 nM | 2500 nM | ||||
| 1 | -S(O)-nBu | 2.2 | 1.9 | 2.7 | 0.3 |
| (R)-1 | (R)-S(O)-nBu | 1.5 | 2 | 2.9 | 0.007c |
| (S)-1 | (S)-S(O)-nBu | 450 | 1.5 | 1.7 | |
| 13a | -S-nBu | >80d | 0.9 | 2.1 | |
| 14a | -SO2-nBu | 25 | |||
| 10a | -C(O)-nBu | >7500 | |||
| 10b | -C(O)NHnPr | >7500 | |||
| 10c | -CO2Et | >7500 | |||
| 10d | CO2H | >7500 | |||
| 12a | -S(O)CH3 | 125 | |||
| 12b | -S(O)nPr | 2.1 | 1.6 | 2.8 | |
| 12c | -S(O)iPr | 3.2 | 1.7 | 2.4 | |
| 12d | -S(O)-nPent | 2.6 | |||
| 12e | -S(O)-nHex | 18 | |||
| 12f | -S(O)(CH2)3OCH3 | 2.1 | 1.9 | 2.6 | 4.7 |
| 16a | -S(O)(CH2)3OH | 37 | 1.1 | 1.5 | |
| 16b | -S(O)(CH2)3Cl | 4 | 1.8 | 2.1 | |
| 16c | -S(O)(CH2)3F | 6.1 | 1.2 | 2.2 | |
| 16d | -S(O)(CH2)3CN | 8.7 | 1.7 | 2.7 | |
Fold-increase in PGE2 levels in A549 cell culture media relative to DMSO. Data color-coded to indicate more active (blue), less active (red) or equally active (white) as compound 1.
Amorphous solid unless otherwise indicated. Solubility in pH 7 citrate buffer, 0.1 M.
Crystalline solid.
Observed inhibition likely from trace 1.
