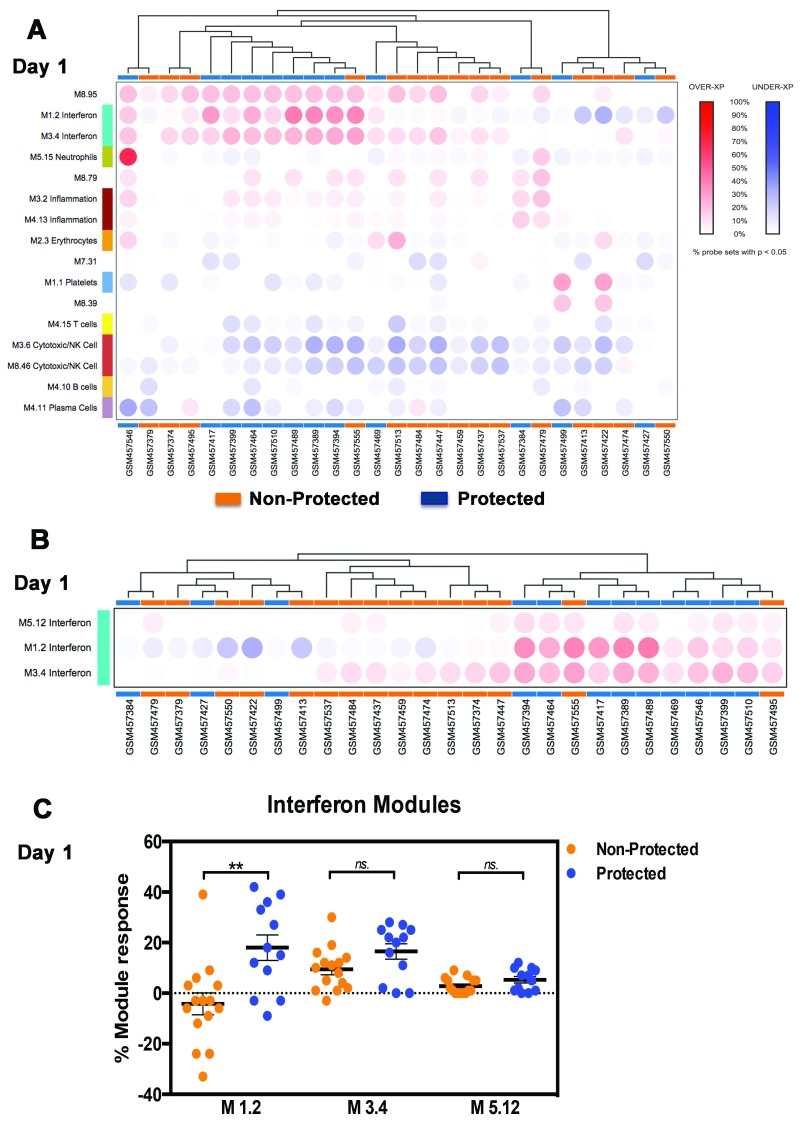
Figure 1. Increased modular interferon response at day 1.
Blood transcriptional responsiveness to malaria vaccination was determined at the modular level in subjects one day following administration of the third dose of RTS,S. A. The percentage of responsive transcripts was determined for each module (co-clustered gene set) and represented by a colored spot on a heatmap where modules are arranged in rows and samples in columns (using a custom web; manuscript describing this resource is in preparation). Increases in transcript abundance compared to baseline pre-third vaccine sample are shown in red and decreases in transcript abundance in blue. Modules and samples are arranged by hierarchical clustering based on patterns of module responsiveness. B. Grouping of samples based on patterns of responsiveness of interferon modules is shown here. C. Responsiveness of the three interferon modules on day 1 is shown on a plot.

