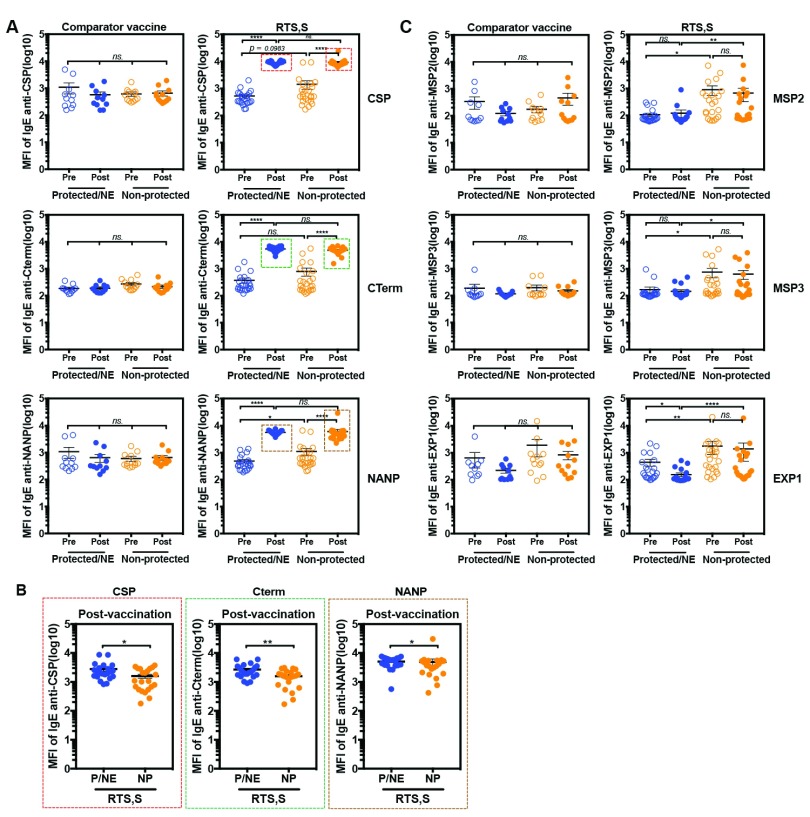
Figure 5. Detection of antigen-specific IgE in serum samples of children who received the RTS,S vaccine or comparator vaccines.
IgE levels are shown for 23 children who received the comparator vaccines (11 non-protected (NP) and 12 protected(P)/Non-exposed (NE) subjects) and 44 children who received the RTS,S vaccine (22 non-protected and 22 protected/NT subjects). Blood samples were collected from children at baseline before receiving the vaccine (pre-vaccination) and 1 month after the 3 rd dose of vaccination (post-vaccination). The children who developed malaria infection during follow up were classified in the “Non-protected” group and those who did not, were classified in the “Protected/NE” group. A) comparison of levels of CSP-, CTerm-, NANP-specific IgE (dilution 1:30), and MSP2-, MSP3-, EXP1-specific IgE (dilution 1: 2,430) in serum samples of comparator vaccine control or RTS,S vaccine groups. Red, green and brown boxes identify the samples that were over the higher limit of quantification. B) Antigen-specific IgE in serum samples of RTS,S vaccinated group identified by the red, green and brown boxes in panel A which were re-run at a higher dilution (1: 21,870). C) Comparison of levels of MSP2-, MSP3- and EXP1-specific IgE in serum samples of comparator vaccine control or RTS,S vaccine; blue represented “Protected/NE” and orange represented “Non-protected”. The results represent means ± standard errors (SE). Statistical significance was determined using Wilcoxon signed-rank test or Mann Whitney test; ns, not significant, * p < 0.05, ** p < 0.01, *** p < 0.001 and **** p < 0.0001. The horizontal lines indicate mean ± standard errors (SE).

