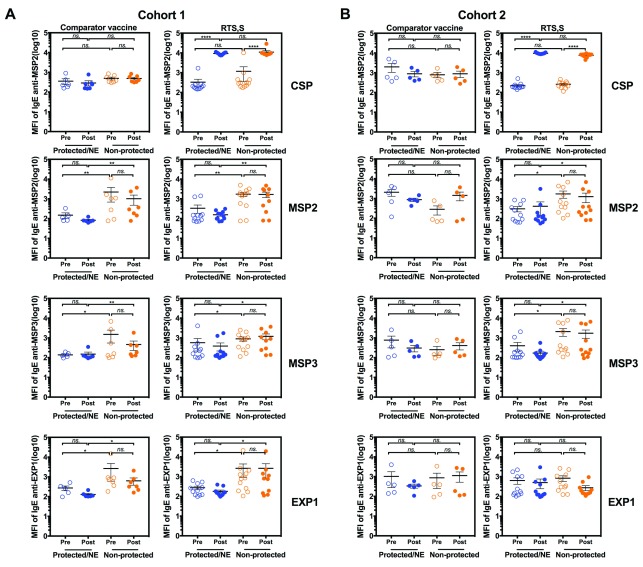
Figure 6. Comparison of specific IgE in serum samples of children from cohort 1 and cohort 2 who received the RTS,S vaccine or comparator vaccines (1:270 dillution).
23 children received comparator vaccines (11 non-protected and 12 protected(P)/Non-exposed (NE) subjects) and 44 children received the RTS,S vaccine (22 non-protected and 22 protected/NE subjects). Blood samples were collected from children at baseline before receiving the vaccine (pre-vaccination) and 1 month after the 3 rd vaccine dose (post-vaccination). The children who developed malaria infection were classified in the “Non-protected” group and those who did not were in the “Protected/NE” group. The samples were diluted at 1:270 for the IgE assay. A) Comparison of CSP-, MSP2-, MSP3- and EXP1-specific IgE levels in serum samples of comparator vaccine control or RTS,S vaccine groups from cohort 1 (low transmission area, passive case detection). B) Comparison of levels of CSP-, MSP2-, MSP3- and EXP1-specific IgE levels in serum samples of comparator vaccine control or RTS,S vaccine groups from cohort 2 (high transmission area, active case detection). Blue represents “Protected/NE” and orange represented “Non-protected”. The results represent means ± standard errors (SE). Statistical significance was determined using Wilcoxon signed-rank test or Mann Whitney test; ns, not significant * p < 0.05, ** p < 0.01 and **** p < 0.0001. The horizontal lines indicate mean ± standard errors (SE).

