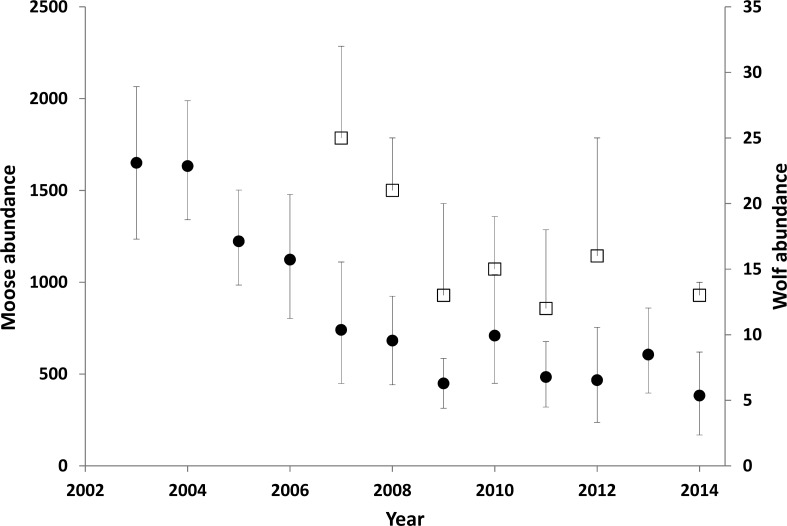
Figure 3. Moose (circles) and wolf (squares) abundance in the treatment area.
Error bars for the moose estimates represent 90% CIs. The upper error bar for the wolf estimates show the maximum estimates, including a buffer around the treatment area. The square represents a minimum estimate. Between 1994 and 2003 the moose population was estimated to have doubled (Serrouya et al., 2011). Data updated from Serrouya et al. (2015).

