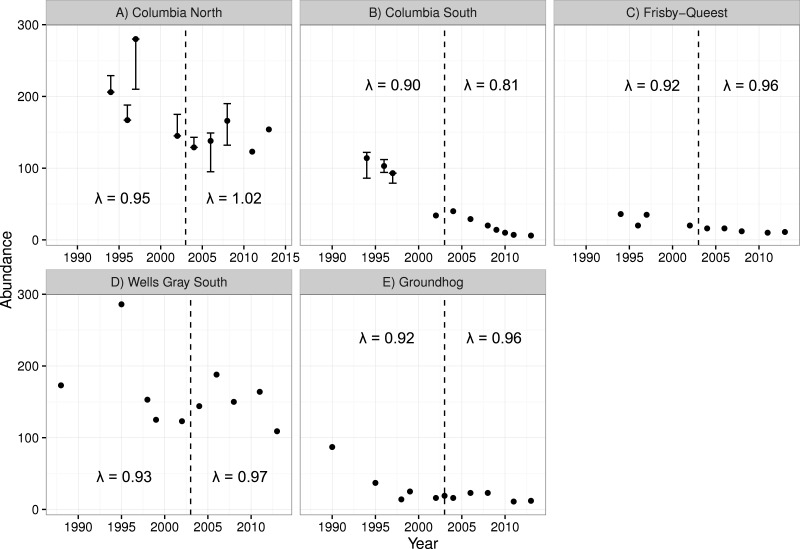
Figure 4. Caribou population estimates for five subpopulations, three in the treatment area (A–C; top row) and two in the reference area (D, E; bottom row).
Error bars are 95% CIs. The dashed vertical line represents the beginning of the moose reduction treatment in 2003. Lambda values to the left of the dashed line represent the years 1994–2004 whereas those to the right of the line represent the years 2004–2013. Data updated from Wittmer et al. (2005).

