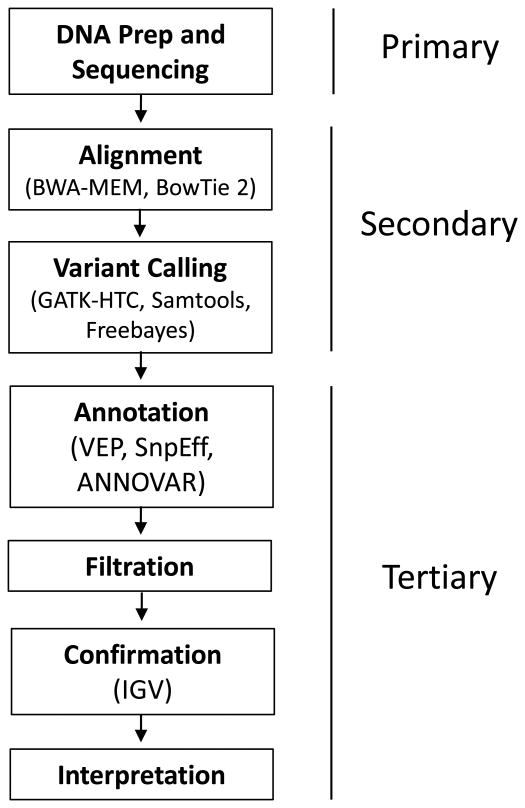
Figure 6. Flow Chart summarizing the analyses of DNAseq data (whole genome and exome).
In each box, the upper part in bold describes the analytical step, and the bottom part in plain text notes specific programs or services that can are employed. Labels on the right indicate a general categorization of the analysis into primary, secondary, and tertiary.

