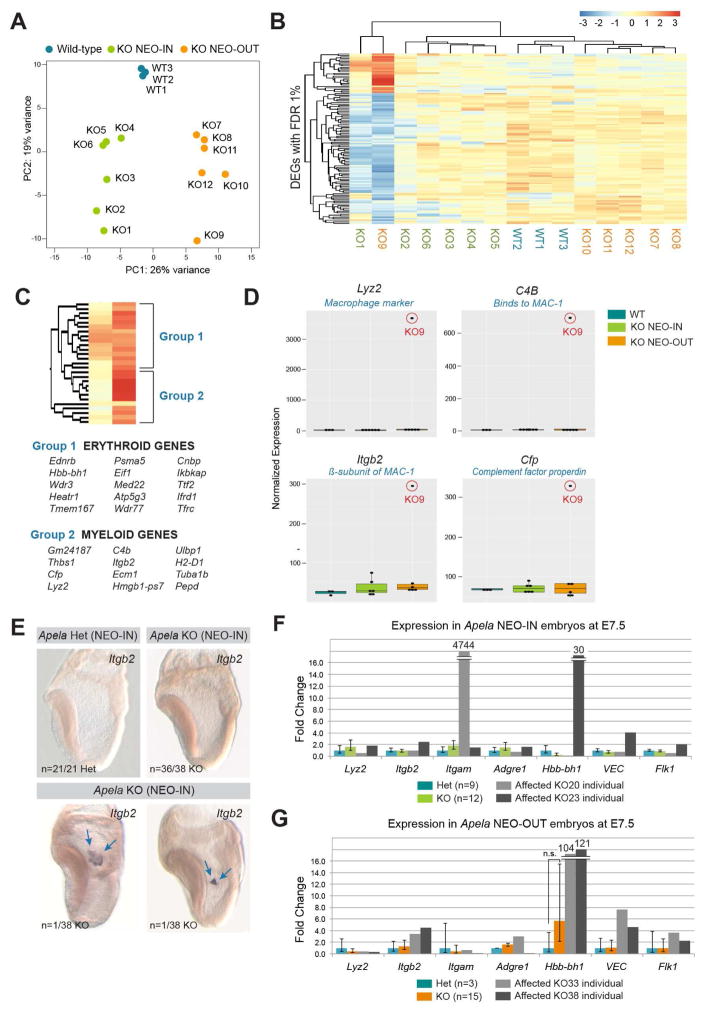
FIGURE 6. Upregulation of erythroid and myeloid markers in Apela KO embryos.
(A) PC analysis separated samples according to genotype along PC1. KO9 exhibited unique, yet similar, variance to KO1 according to PC2. (B) Heat map of sample-to-sample distances between KO9 and other samples based on 116 DEGs identified in Figure S5A. Color scale indicates rlog transformed expression values. (C) Upregulated DEGs identified in (B) were classified by expression of erythroid (Group 1) and myeloid (Group 2) genes. (D) Boxplots of normalized expression values for genes with the highest upregulation in KO9. (E) Itgb2 expression by wholemount in situ hybridization in Apela KO (NEO-IN) embryos shows ectopic clusters of cells localized to extraembryonic tissue (blue arrows). (F–G) qRT-PCR of individual Apela (NEO-IN) and (NEO-OUT) embryos at E7.5. Data are represented as mean ± SEM.

