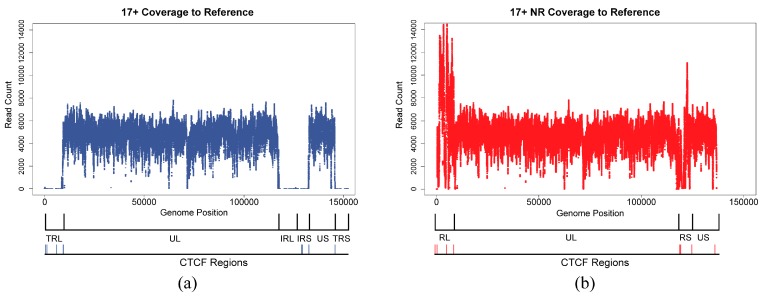
Figure 5.
Coverage plots of reads aligning uniquely to the full-length HSV1 reference and the NR-reference. (a) The number of reads that aligned uniquely to all positions in the full-length HSV1 genome is on the y-axis (range from 0 to 10,307 with a median of 7548), while the genome position is on the x-axis. Genomic features are indicated under the plot including locations of CTCF motif clusters. Drops in alignment coverage for uniquely mapping reads are expected in the regions corresponding to the repeat regions. (b) The number of reads that aligned uniquely to all positions in the HSV1 NR-reference is on the y-axis (range from 0 to 17,324 with a median of 7597), and the genome is on the x-axis. Coverage is maintained in the representative repeat region. Genomic features are indicated as in (a).

