Figure 5.
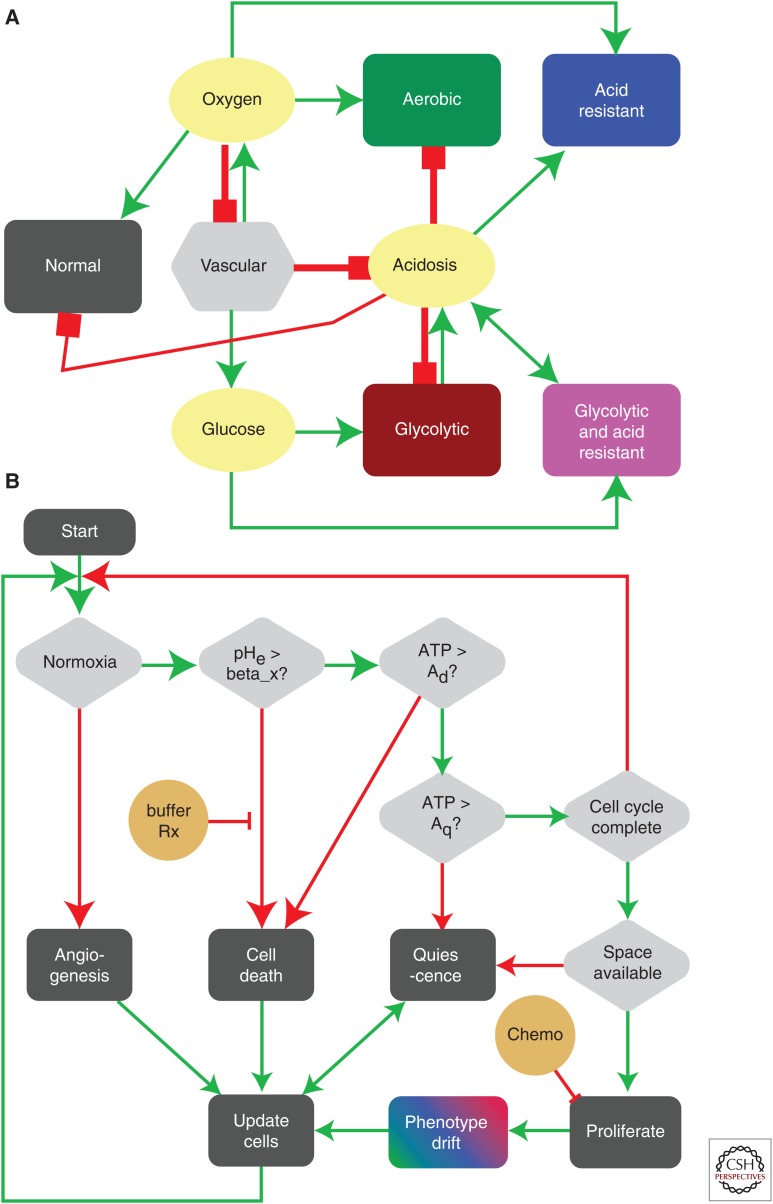
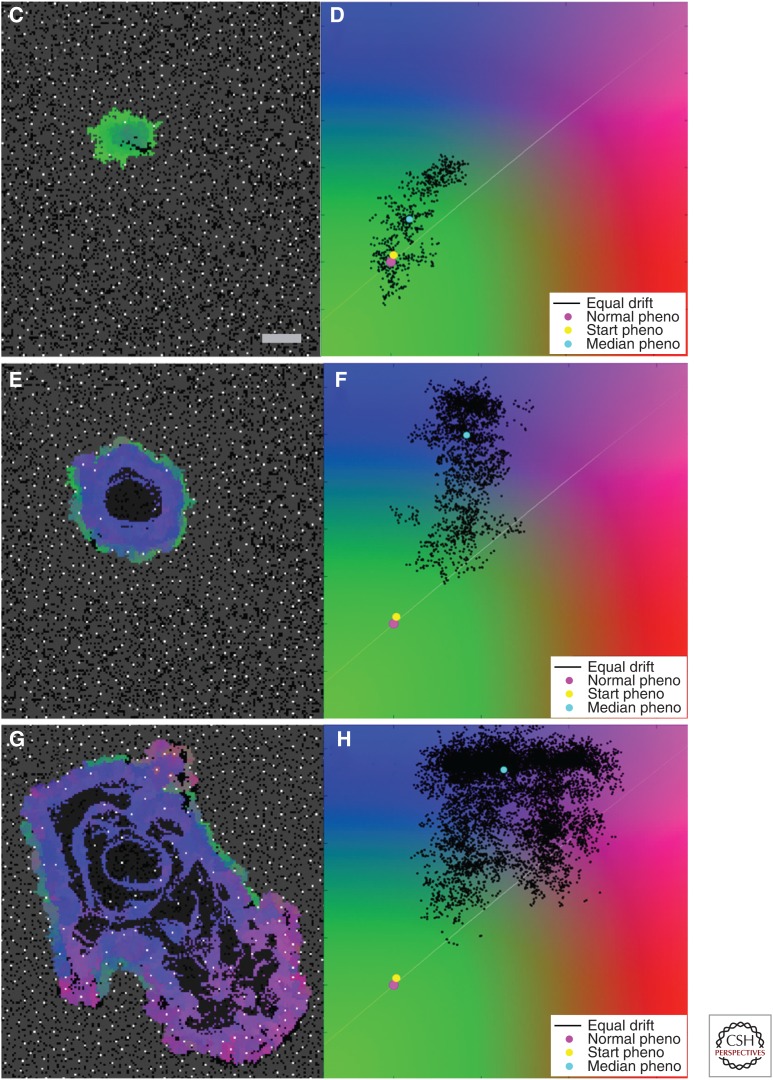
Multiscale metabolic cancer invasion model. (A) A hybrid cellular automaton (HCA) model interaction network highlights positive (green) and negative (red) cellular and microenvironmental interactions. (B) Cell life-cycle flowchart that every cell experiences, dictating cell proliferation, death, and mutation depending on the levels of ATP, oxygen, and pH. (C,E,G) Heterogeneous tumor growth and evolution at 2, 8, and 20 weeks. (D,F,H) Corresponding phenotypic (x-axis, glycolytic activity; y-axis, acid resistance) distribution at the same simulation time points.


