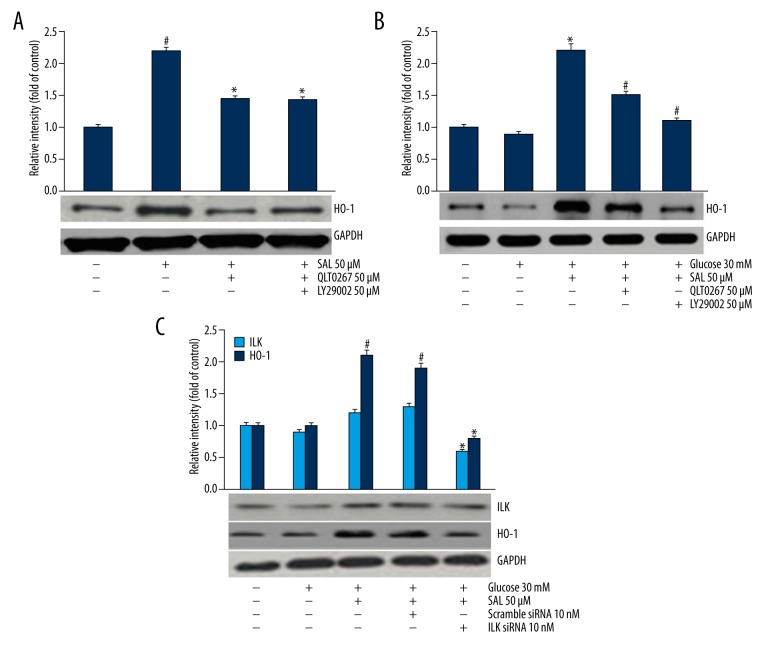
Figure 5.
The relationship between HO-1 expression and Akt/ILK and JNK signaling pathways was investigated. The data were analyzed by independent-samples t test. (A) HO-1 expression was evaluated after treatment of 50 μM LY294002 for 1 h and 50 uM QLT0267 for 0.5 h (ILK inhibitor) in normal concentration of glucose (5 mM). # Compared with control, * compared with salidroside group P<0.05. (B) HO-1 expression was assessed after treatment with ILK inhibitor (50μM LY294002, 1 h) in high glucose (30 mM). * Compared with control, # compared with high glucose+salidroside group P<0.05. (C) HO-1 expression was assessed after treatment with ILK siRNA. * Compared with high glucose+salidroside group, # compared with high glucose group P<0.05.

