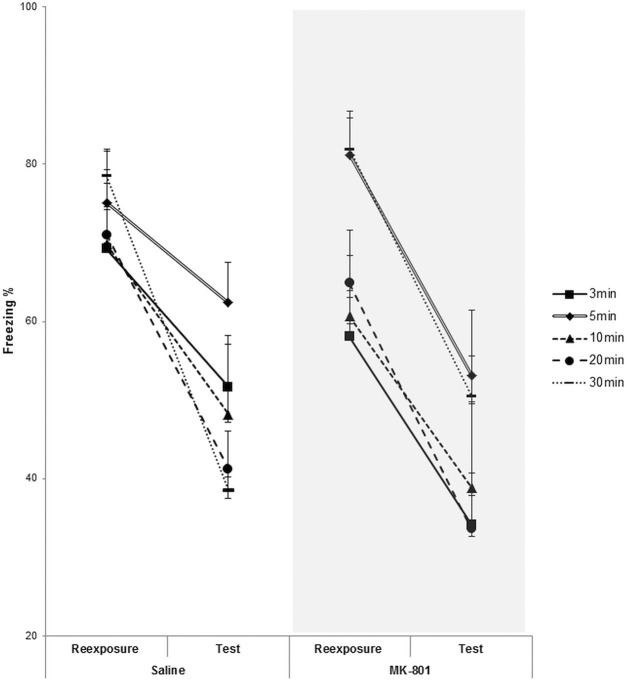
Figure 4.
Consistent reductions in freezing from reexposure to test. Analysis of the freezing at the start of context reexposure (first 3-min) and at test from the experiment in Figure 1. There were consistent reductions in freezing in all conditions (except for Sal 5-min). Data is presented as mean + SEM. n = 14 (Sal-MK/3 min), 13 (Sal/5 min), 7 (MK/5 min), 8 (Sal-MK/10–20 min), 20 (Sal/30 min), and 22 (MK/30 min).

