
Figure 1.
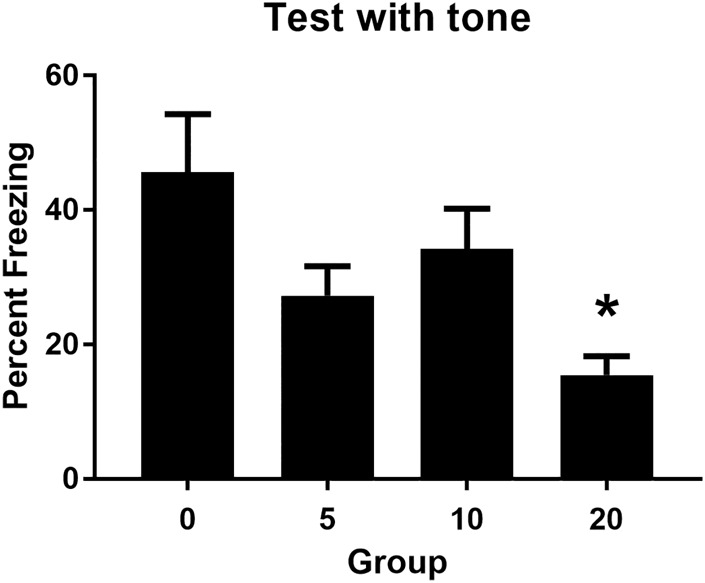
The mean (+SEM) level of freezing during test presentations of the tone for each group in Experiment 1. The asterisk denotes that freezing to the tone in Group 20 was significantly lower than the average level of freezing to the tone among the other three groups.