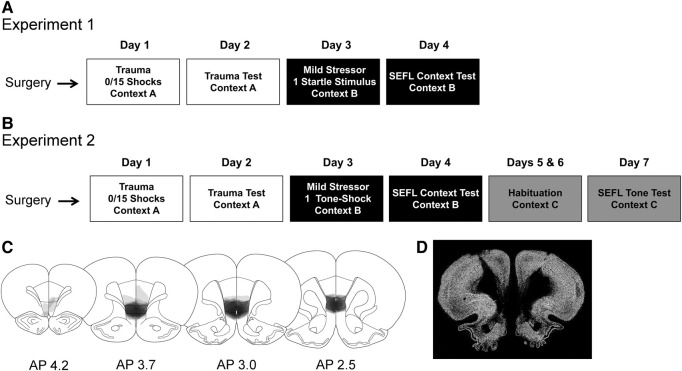
Figure 1.
Experimental timeline and depiction of lesion size. (A,B) Experimental timeline for Experiment 1 (A) and Experiment 2 (B). Of note, 2 wk were allowed for post-operative recovery. (C) Distribution of lesion magnitude in the medial prefrontal cortex across animals in Experiment 1. Each layer of shading represents a single animal. Coronal sections are labeled with respect to their distance anterior to bregma. Distribution of lesions was nearly identical in Experiment 2. (D) Representative immunofluorescent image of neuronal loss seen at the central focus of lesion by NeuN staining.

