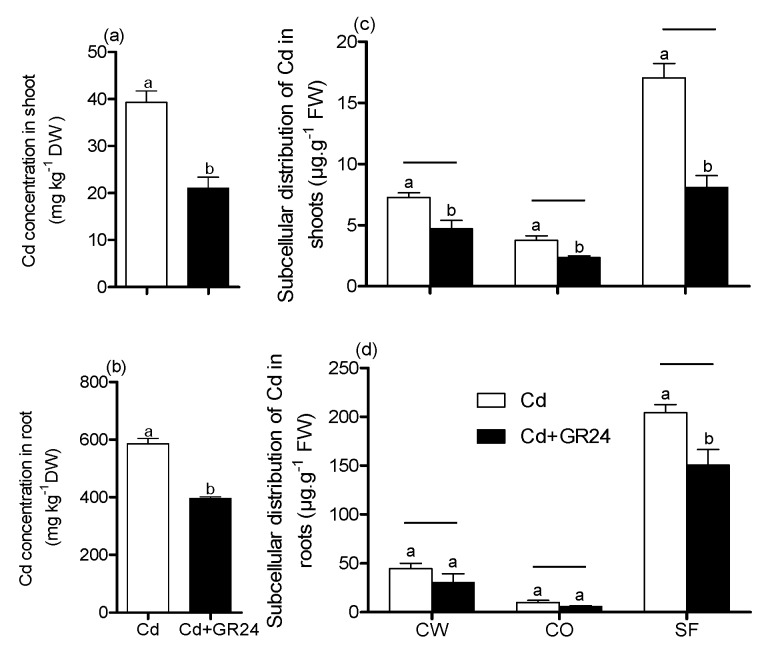
Figure 2.
The effects of the GR24 on Cd concentration and subcellular distribution in plant tissues. Values are means ± SD (n = 3). CW: cell wall; CO: cell organelle; SF: solutable fraction. The dates of CK and GR24 are not shown in this Figure. Different letters above the bars were significantly different (a,b), significant differences under the same horizontal line (c,d) at p < 0.05. DW: dry weight; FW: fresh weight.

