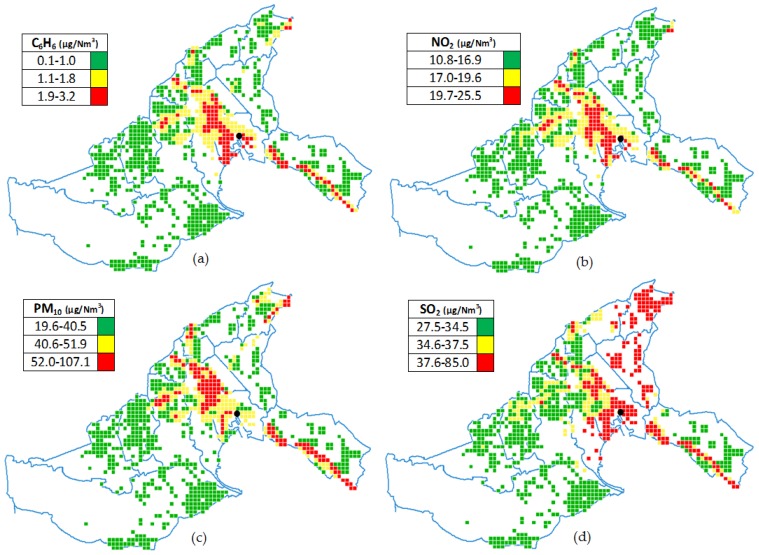
Figure 1.
Mathematical modeling of residential exposure to air pollutant in study area, stratified to tertile of exposure: (a) Benzene exposure; (b) Nitrogen dioxide exposure; (c) Particular matter exposure; (d) Sulfur dioxide exposure. 400 × 400 m cells correspond to area populated by one or more inhabitants in 1995–2009 period. The blue line corresponds to the boundaries of individual municipalities. The black point corresponds to the location of the thermal power plant.

