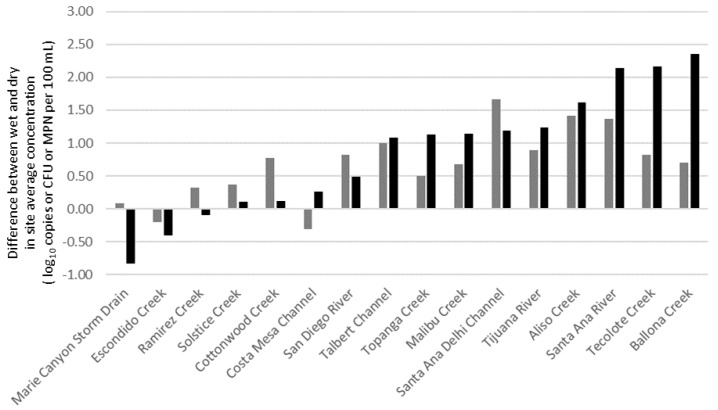
Figure A2.
Site average concentration (in log10 unit) in wet weather subtracted by that in dry weather for HF183 (black bars) and for enterococci (gray bars). The HF183 site average concentration was calculated by the Poisson approach as described above in the Appendix A. The enterococci site average concentration was calculated directly as the geomean. Sites are sorted from left to right by wet vs. dry differences in site average HF183 concentrations.

