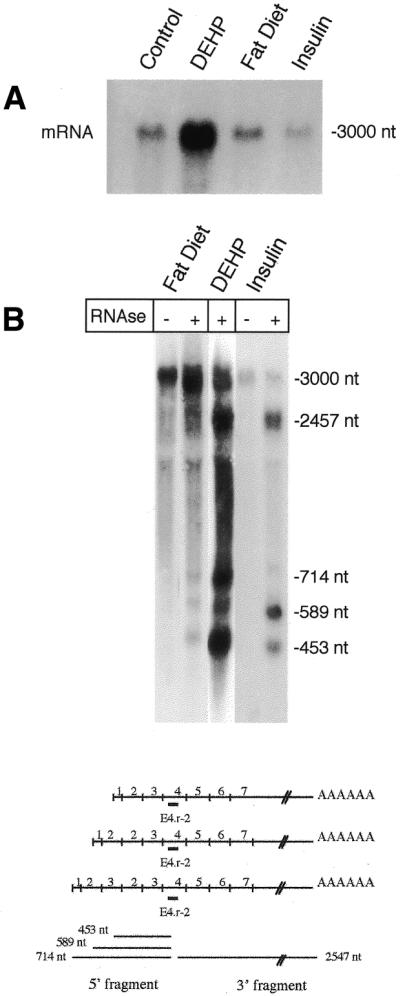
Figure 3.

Northern blot analysis and RNase H digestion of total RNA from liver of treated rats. (A) Northern blot of liver COT mRNA levels of rats treated as described in Materials and Methods. (B) Representative results of three experiments in which 20 µg of total RNA from livers of treated rats was incubated with the primer E4.r-2 and digested with RNase H (+). The lanes marked with – correspond to samples not digested with RNase H. The diagram shows the expected products formed after binding the primer E4.r-2 to RNA and digesting with RNase H as described (5).
