
Figure 8.
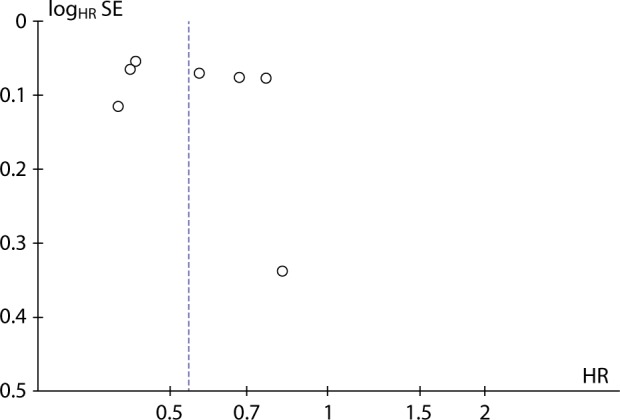
Funnel plot for primary outcome analysis on survival.
Notes: Each study is represented by a circle, with the HR for progression or death (ie, the result) along the x-axis and the SE of the natural logarithm of the HR (ie, the reliability) on the y-axis. The smaller the logHR SE, the more reliable the results from those studies are, meaning less reliable studies will be found closer to the x-axis. There is an even spread of studies on either side of the vertical blue line, representing the overall effect estimate (HR =0.54).
Abbreviations: HR, hazard ratio; SE, standard error.