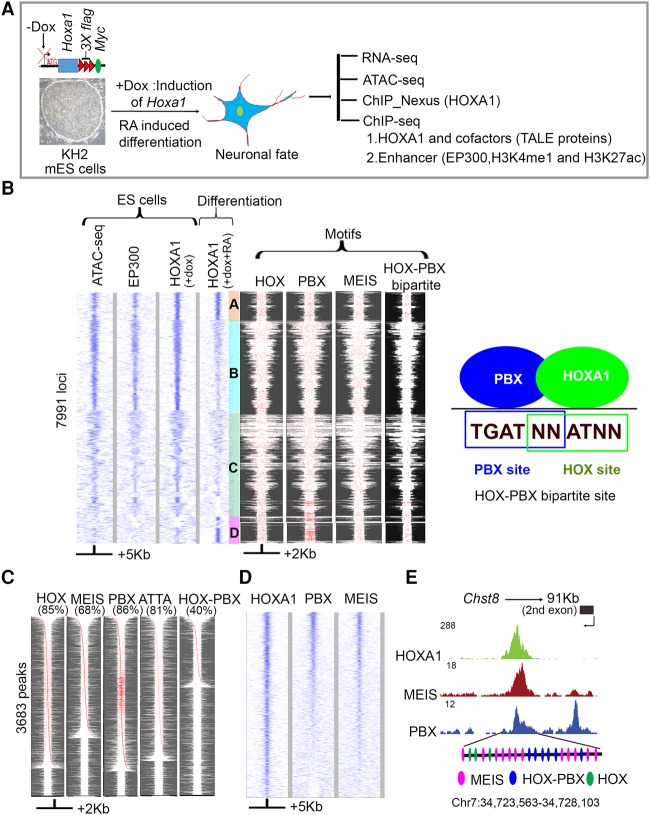
Figure 1.
Genome-wide identification and analysis of HOXA1-bound regions reveal overlaps with PBX and MEIS binding. (A) Experimental design for differentiation and analysis where Dox (+Dox) induces epitope-tagged Hoxa1 and retinoic acid (+RA) induces programmed differentiation of ES cells into neural fates. (B) Heat maps of genome-wide occupancy of HOXA1 in ES cells (+dox) and differentiated cells (+dox +RA) defined by ChIP-seq. The occupancy of EP300 and chromatin state (ATAC-seq) in ES cells is also shown. Analyses of ES and differentiated cells reveal four distinct groups (A–D) of bound regions. The four columns on the right show the spatial distribution of consensus motifs for HOX, PBX, MEIS, and HOX-PBX bipartite binding sites in the corresponding genomic regions. Best FIMO matches (P ≤ 1 × 10⁻⁴) for all variants of the HOX, PBX, and MEIS, and HOX-PBX bipartite motifs are highlighted in red. A diagram illustrates the relationship of PBX and HOX binding sites in HOX-PBX bipartite motifs (far right panel). Groups A and D, representing HOXA1-bound regions in differentiated cells, show increased presence of HOX-PBX bipartite sites and tandem clusters of PBX motifs. (C) HOXA1-bound regions in differentiated cells are enriched for consensus HOX, PBX, and MEIS motifs. For each TransFac motif, FIMO matches (P ≤ 1 × 10⁻⁴) are shown in red. The respective motif and % of peaks with the motif are indicated (top of each column). Each row is independently sorted by the distance of the central-most motif to the peak center. Many rows of HOXA1-bound regions show multiple binding motifs in a peak (red dots). (D) Heat map shows extensive co-occupancy of HOX, PBX, and MEIS on HOXA1 targets in differentiated cells. The plots use IP coverage of z-score matrix for PBX and MEIS binding at HOXA1 peaks. Rows are sorted by the intensity of the PBX signal within the central 1-kb region. In B–D, the size of regions flanking the center of the peak of HOXA1 binding are shown at the bottom. (E) UCSC Genome Browser shots showing PBX, MEIS, and HOXA1 in exon 2 of Chst8. Clustering of multiple HOX, HOX-PBX, and MEIS binding sites are also shown at the bottom for the HOXA1-bound region.

