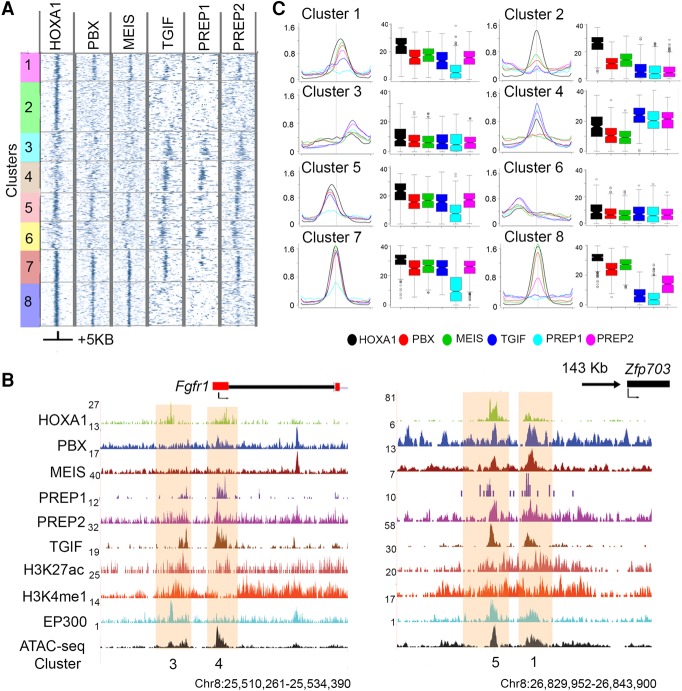
Figure 2.
Patterns of co-occupancy of TALE proteins on HOXA1 targets define eight distinct clusters. (A) Heat maps for occupancy of individual TALE factors at HOXA1 peaks using IP coverage of z-score matrix after k-means-clustering (k = 8). Only positions of positive z-score are shown. A ±5-kb region flanking the center of the peaks of HOXA1 binding is shown. (B) Average binding levels, shown as line and box plots, illustrate the distinct properties with respect to relative binding of each protein and its spatial distribution of each cluster in A. Box plots are row sums from the central 1 kb of each column. (C) UCSC Genome Browser shots (coordinates from version mm10) of Fgfr1 and Zfp703 loci, showing HOXA1-bound regions along with occupancy of TALE cofactors, activator protein EP300, enhancer marks, and chromatin state. The clusters to which these bound regions map are noted at the bottom.

