Figure 6.
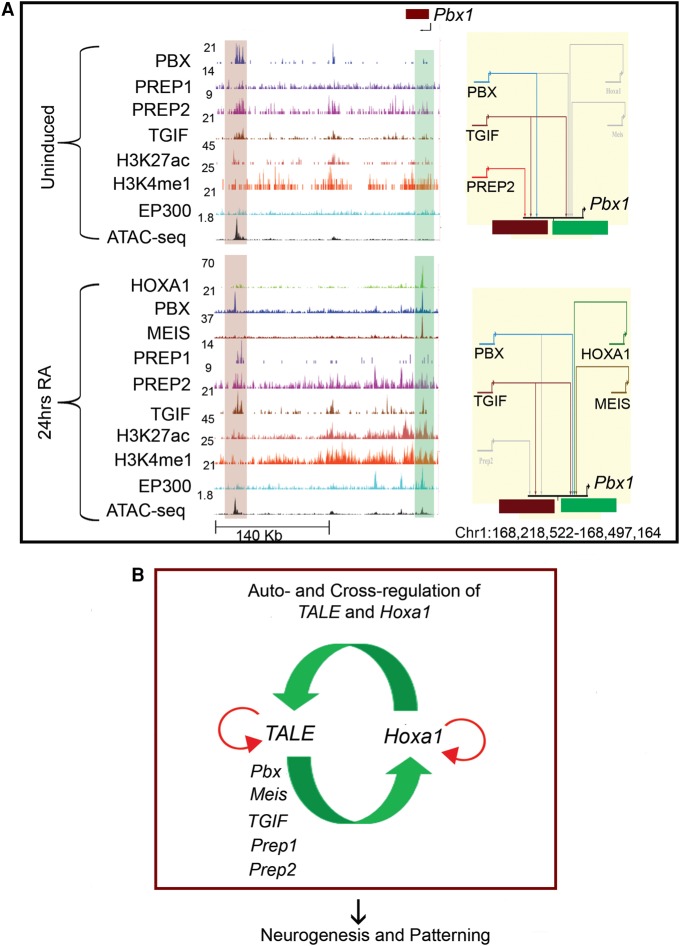
Auto- and cross-regulatory interactions between HOXA1 and TALE proteins. (A) UCSC Genome Browser shots (left) for the Pbx1 locus showing binding of HOXA1 and occupancy of the TALE family members in ES cells (top) and differentiated cells (bottom). The presence of modified histone marks (H3K4me1 and H3K27Ac), occupancy of the EP300 activator protein and ATAC-seq at these genomic loci are also shown. The shaded areas indicate bound regions. In the BioTapestry plots (right panels), solid colored lines indicate binding of TALE factors, gray lines indicate lack of binding, and dotted lines represent decreased binding. (B) Model summarizes auto- and cross-regulatory interactions among Hoxa1 and TALE genes and their output on downstream targets.

