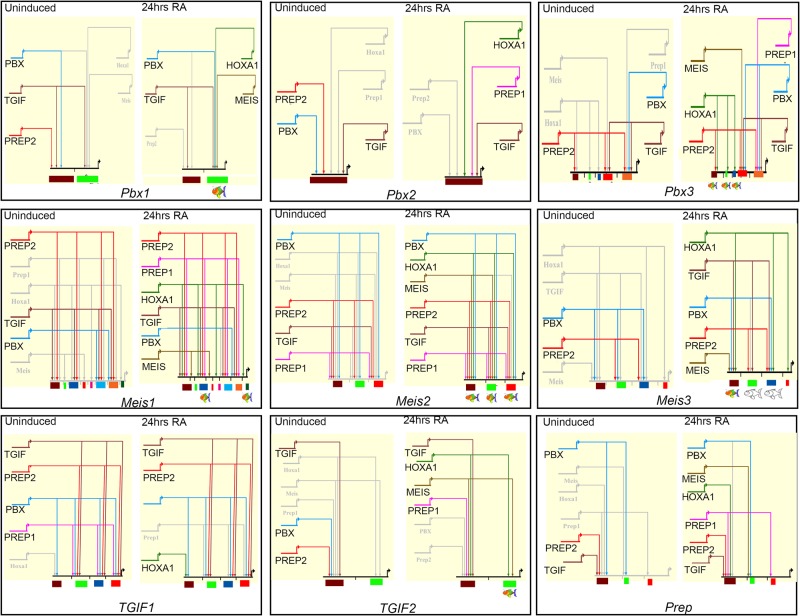
Figure 7.
BioTapestry models depicting the auto- and cross-regulatory interactions between HOXA1 and TALE members. ES cells are depicted on the left and differentiated cells on the right. Solid colored lines indicate binding of each specific TALE factor or HOXA1, gray lines indicate lack of binding, and dotted lines represent decreased binding. At the bottom, the colored boxes indicate each TALE locus and the respective cis-regulatory regions that integrate the specific binding inputs. Colored cartoon fish under cis-regulatory elements indicate those with spatially-restricted regulatory activity, while the uncolored fish indicate a lack of reporter activity.

