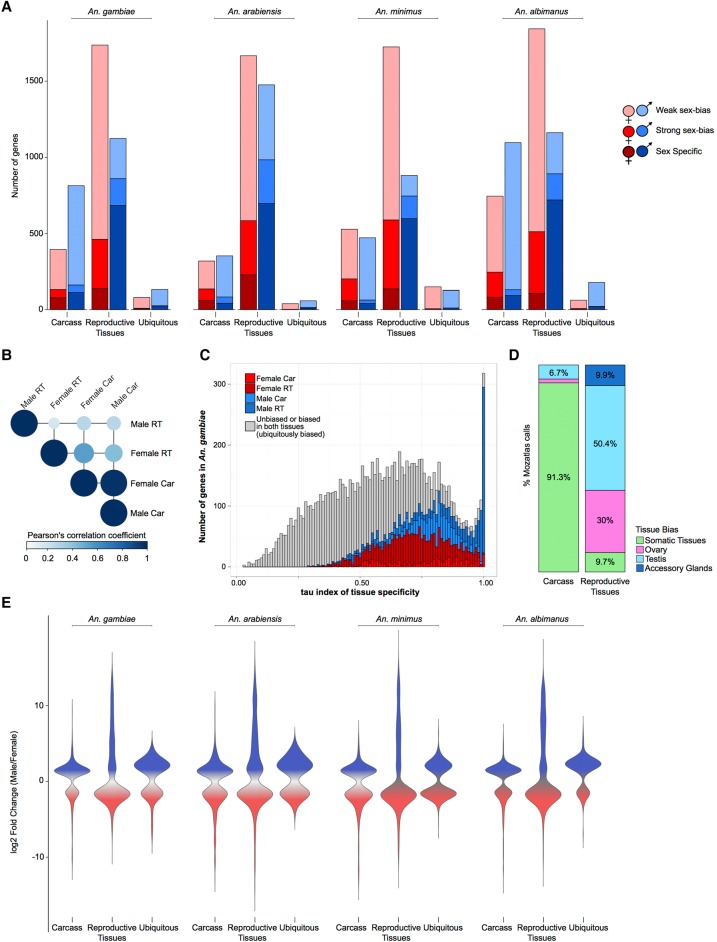
Figure 1.
Sex-biased gene expression in the Anopheles genus. (A) Total number of sex-biased genes in the four study species for each of three tissue expression biases: carcass, reproductive tissues, and ubiquitously sex-biased. Female (red hues) and male (blue hues) sex-bias magnitudes are depicted as: dark, sex specific; medium, strongly sex-biased; light, weakly sex-biased. (B) Average Pearson's correlation coefficient of gene expression between sexed tissues in An. gambiae. (C) Distribution of tau (τ) index of tissue specificity in An. gambiae for each sex- and tissue-biased expression classification, where increasing τ values respond to increased sample-specific expression. Genes with very high τ values (∼1) are highly enriched for male reproductive tissue-biased genes. (D) Comparison of sex-bias gene expression categories, produced by this differential expression pipeline using RNA-seq, with results from a previous microarray study for An. gambaie, i.e., MozAtlas (Baker et al. 2011), showing strong congruence of gene expression bias in tissue classifications. (E) Magnitude of gene expression ratios (fold change male/female) for each species. Male-biased genes of the reproductive tissues display the largest magnitude and range of biased expression.

