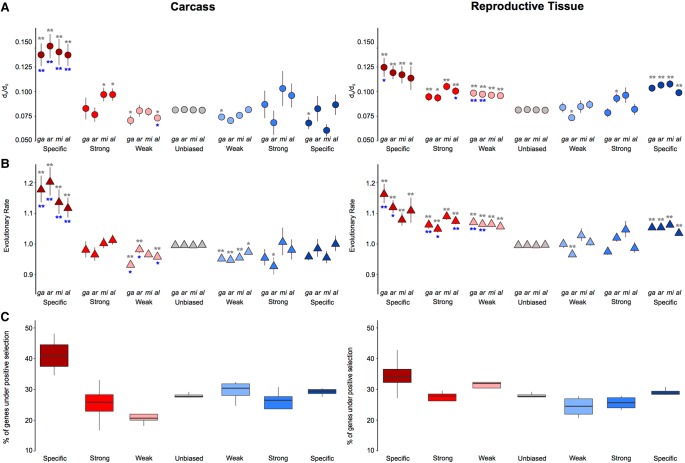
Figure 3.
Sequence divergence rates of the four-species orthologs and selection tests. Average DNA sequence (A) and protein sequence (B) divergence levels of the four-species orthologs from each species plotted by the sex-bias expression classification. Wilcoxon rank-sum tests are used to test for significant differences when comparing divergence levels between the sexes (blue asterisks) or between sex-biased categories and unbiased genes (gray asterisks) and indicates: (*) P-value < 0.05, (**) P-value < 0.001. (C) Cross-species average of percentage of genes showing significant positive selection among the four-species orthologs for each sex-biased classification, in the carcass and in the reproductive tissues.

