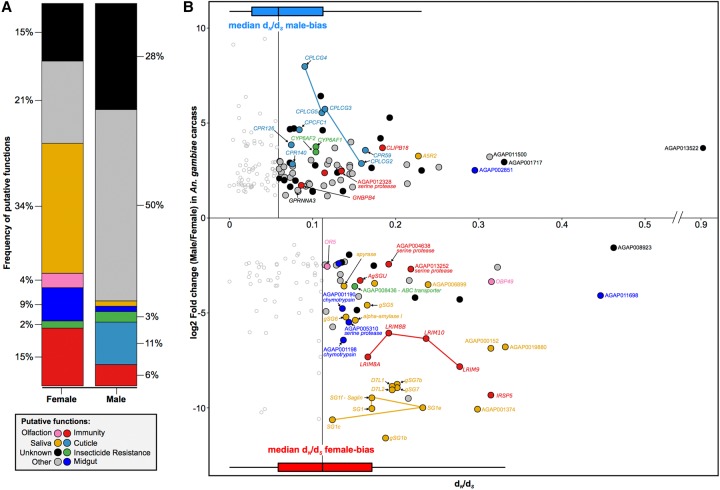
Figure 5.
Functional analysis of rapidly evolving and highly sex-biased genes from the carcass of An. gambiae. (A) Relative proportions of putative functions among rapidly evolving sex-biased genes (sex-specific and strongly biased) in the carcass of An. gambiae. (B) Sex-biased expression ratios (in log2 fold change male/female) over sequence divergence rates (in dN/dS) for genes displaying strong bias or sex-specific expression in the carcass of An. gambiae. Horizontal box plots indicate dN/dS values for female- (red) and male-biased (blue) genes, highlighting the median values of each sex, which were used as a cutoff for downstream analysis. Genes with dN/dS value greater than the median of each sex are highlighted with putative functions using Gene Ontology (GO), orthology-based predictions, and community annotations (colored circles). Empty circles indicate genes evolving below our threshold of sequence divergence.

