Figure 3.
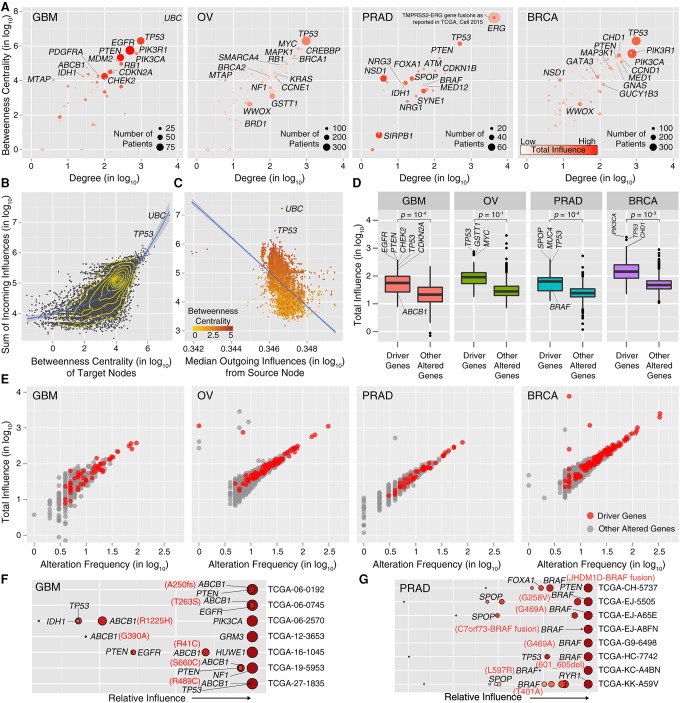
Network properties of driver genes. (A) The centrality of the predicted drivers in STRING v10 network. The size of the circles is proportional to the alteration frequency of the driver gene. The color scale represents the total influence of the driver gene on the expression outliers. (B) Correlation between influence and centrality. Each dot represents a target node receiving a certain amount of influence from all source nodes in the network. A lowess regression line is represented in blue. (C) Correlation between incoming and outgoing influence of a node. Each dot represents a node in the network, and the color scale represents its betweenness centrality. A linear regression line is represented in blue. (D) Boxplot of the total influence of driver genes predicted by HIT'nDRIVE on the expression outliers compared with that of other altered genes (genes not predicted as drivers). (E) Correlation between gene influence and its alteration frequency in the respective patient cohort. (F) Relative influence of driver genes in each patient in GBM cohort with mutation in ABCB1. (G) Relative influence of driver genes in each patient in PRAD cohort with mutation in BRAF. All gene influence values have been multiplied by 105 before log transformation.

