
Figure 6.
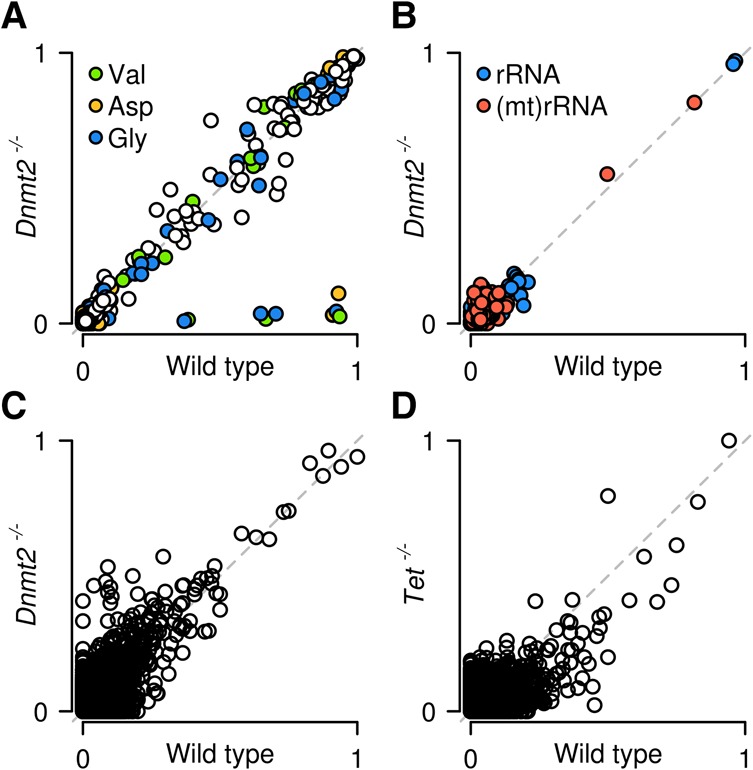
Site-specific methylation analysis by whole-transcriptome bisulfite sequencing. Scatter plots show nonconverted cytosines for tRNA (A), rRNA (B), and mRNA (C) in wild-type and Dnmt2 knockout ES cells. Methylation ratios are specifically reduced for C38 of tRNA(Asp), tRNA(Gly), and tRNA(Val) in Dnmt2 knockouts. (D) Scatter plot for mRNA in wild-type and TET-deficient ES cells.