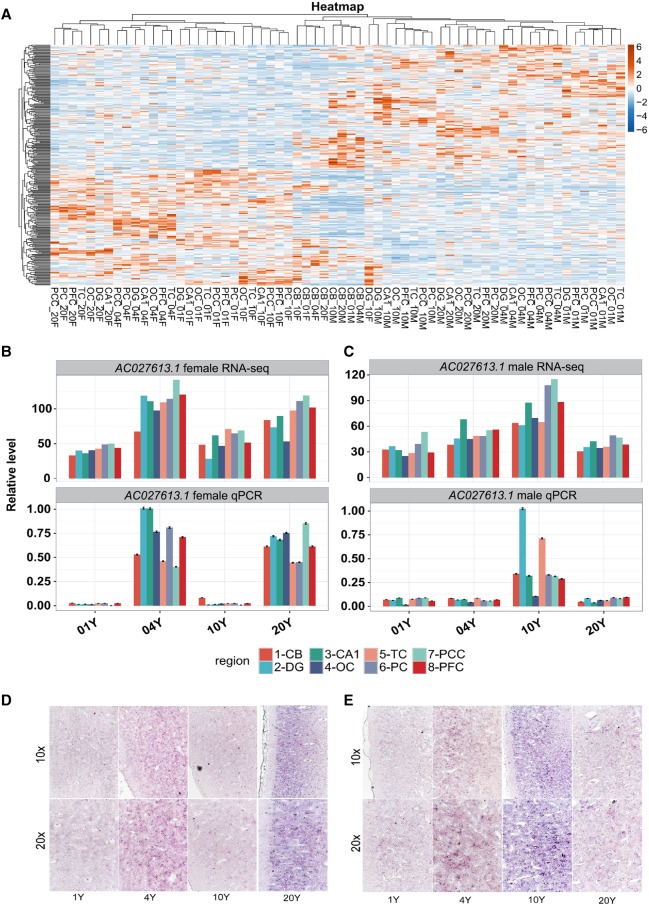
Figure 4.
Characteristics of sex-biased lncRNA expression. (A) Hierarchical clustering heat map representation of the sex-biased lncRNA expression level. The sex-biased lncRNAs were obtained by t-test analysis (P-value < 0.01). (B,C) Bar plot of a sex-regulated lncRNA AC027613.1 expression pattern in female (B) and male (C) samples across the four ages with RNA-seq expression level (top) and qRT-PCR level (bottom); (B) female samples, (C) male samples. (D,E) Representative ISH images of the AC027613.1 expression in female (D) and male (E) PFC across the four ages with 10× amplification (top) and 20× amplification (bottom). The images are representative of replicates of three independent experiments.

