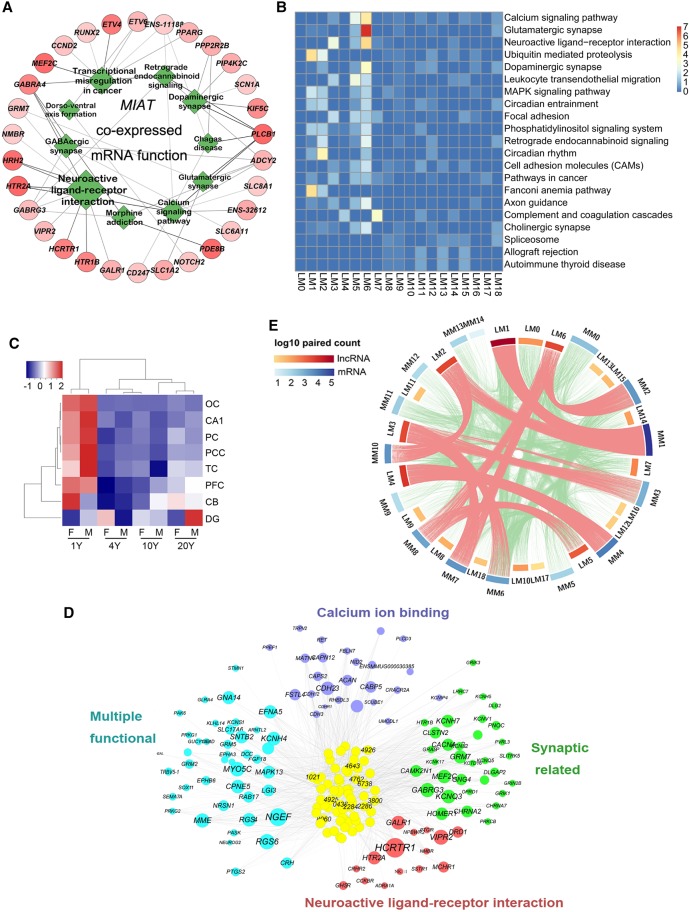
Figure 6.
Co-expression network illustration between lncRNAs and mRNAs. (A) Functional presentation of mRNAs that were co-expressed with lncRNA MIAT. Green rhombuses are the functional terms and the size represents the statistical significance. The red circles are the mRNAs. The line thickness represents the correlation coefficient of mRNAs and MIAT, and the shade degree of mRNAs represents the total statistical significance of mRNAs and MIAT. (B) Heat map presentation of the KEGG pathways for mRNAs associated with each lncRNA module. The function of each lncRNA module was annotated by co-expressed mRNAs. Color degree of each cell represents the statistical significance of pathways (−log10[Qvalue]). (C) Hierarchical clustering heat map presentation for the expression pattern of Module 6 lncRNAs. Higher expression level was observed in 1-yr samples for all brain areas except for DG. (D) The co-expression network of M6 lncRNAs and the co-expressed mRNAs. LncRNAs are in the center and co-expressed mRNAs are on the outside. The numbers on the lncRNAs are the last four digits of the lncRNA ID. LncRNA shade degree, and mRNA circle and word size represent interaction strength (sum of correlation coefficients) between M6 lncRNAs and mRNAs. Genes for different neuronal functions were presented with respective colors. (E) Circular presentation of module-module interaction between lncRNAs and mRNAs. Scale bars were the same as in B. Shade degree of the cambered bars for each lncRNA module (LM) and mRNA module (MM) represents the log10 value of the co-expressed pair number in each module.

