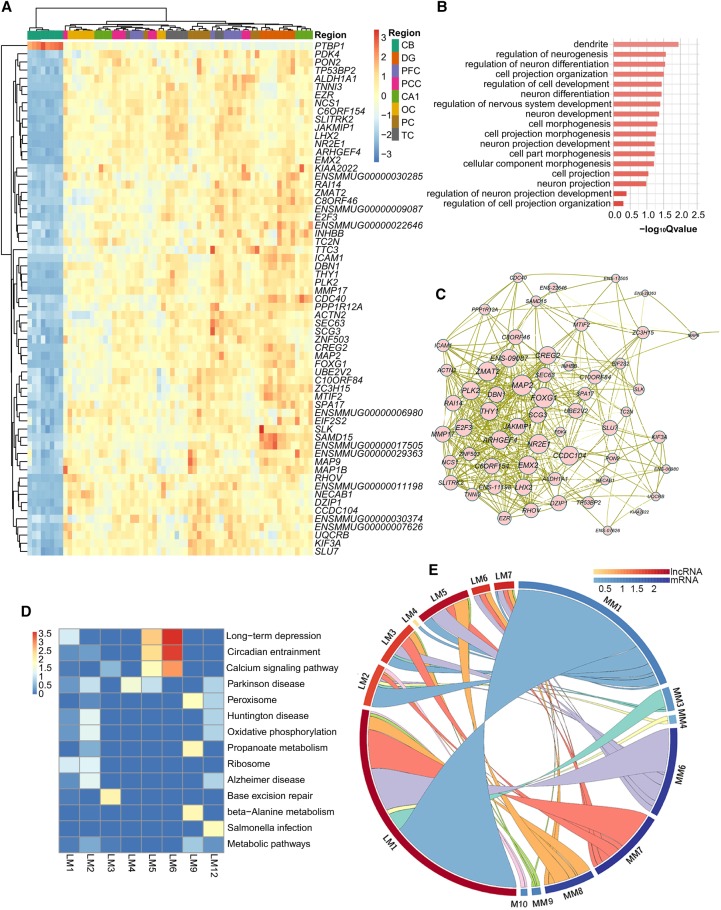
Figure 7.
Negative regulatory networks between mRNA-lncRNA and lncRNA-lncRNA. (A) Hierarchical clustering heat map of the PTBP1 and the mRNAs negatively regulated by PTBP1. Color bar represents the log10 RPKM. (B) Bar plot presentation of the functional terms of mRNAs negatively regulated by PTBP1. Length of bar represents the statistical significance of pathways (−log10 [Qvalue]). (C) Co-expression network presentation of mRNAs that were negatively regulated by PTBP1. Circle and word size of the co-expressed mRNAs represent additive interaction strength (sum of correlation coefficients) among mRNAs. (D) Heat map presentation of functional clustering by the negatively paired mRNAs of each lncRNA module. Color degree of each cell represents the statistical significance of pathways (−log10 [Qvalue]). (E) Circular presentation of association between lncRNA and mRNA modules that were negatively coregulated by lncRNAs. The length of the cambered bar represents the regulating lncRNA number between lncRNAs and mRNAs, and the arc color of the cambered bar represents the ratio between regulating lncRNAs and the gene number in each module. (MM) mRNA modules, (LM) lncRNA modules.

