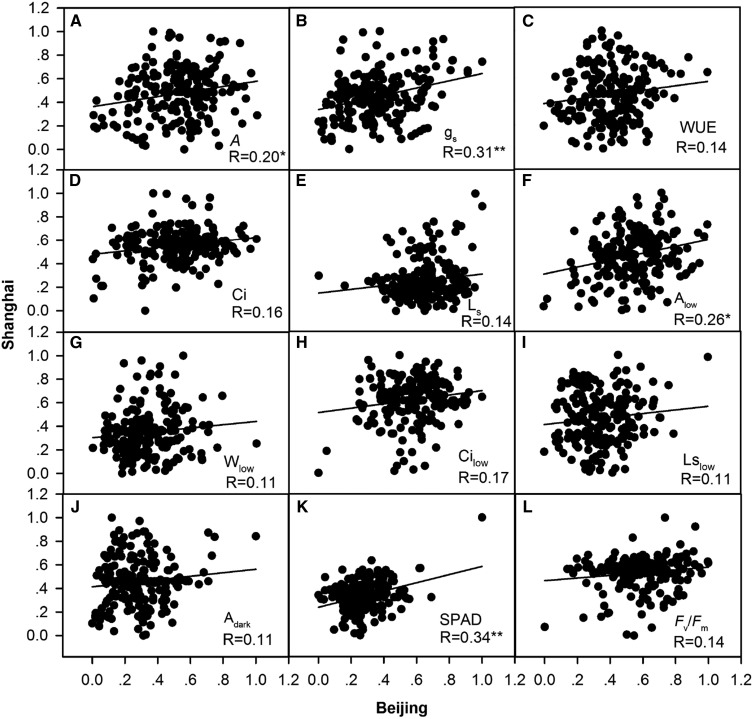
Figure 3.
Self-correlation of each photosynthetic trait in the global minicore panel and elite rice lines grown in BJ and SH environments. The Pearson correlation coefficient (R) values were calculated. Asterisks represent P < 0.05 (*) and P < 0.01 (**). The PT abbreviations are defined in Figure 1.

