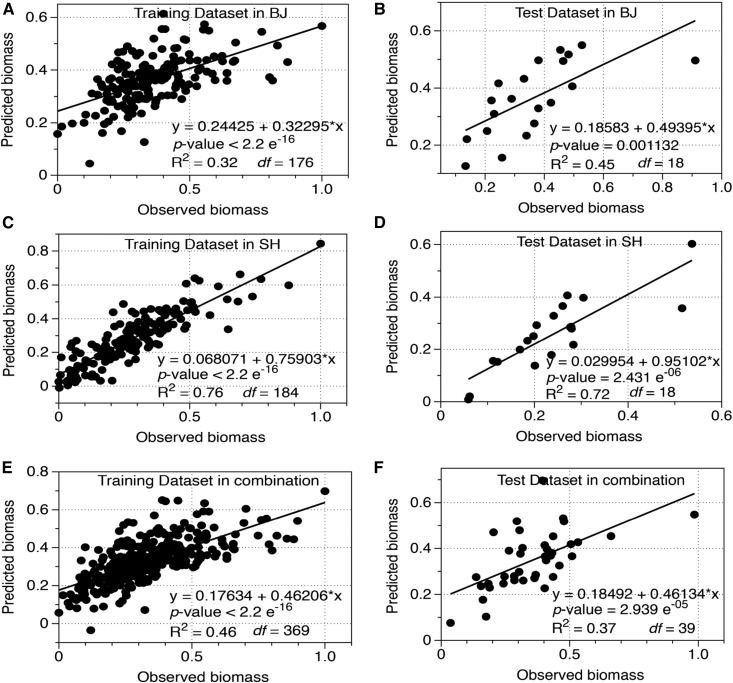
Figure 4.
Model construction and cross-validation in the global minicore panel and elite rice lines under BJ (A and B), SH (C and D), and the combined (E and F) data sets. The training data set consists of 90% of the whole data set, and the remaining 10% of items were used as a test data set (for details, see “Materials and Methods”). Predicted values of biomass versus observed values of biomass were used during the cross-validation. The determination index (R2) reflects the accuracy of regression between predicted and observed values.

