
Figure 2.
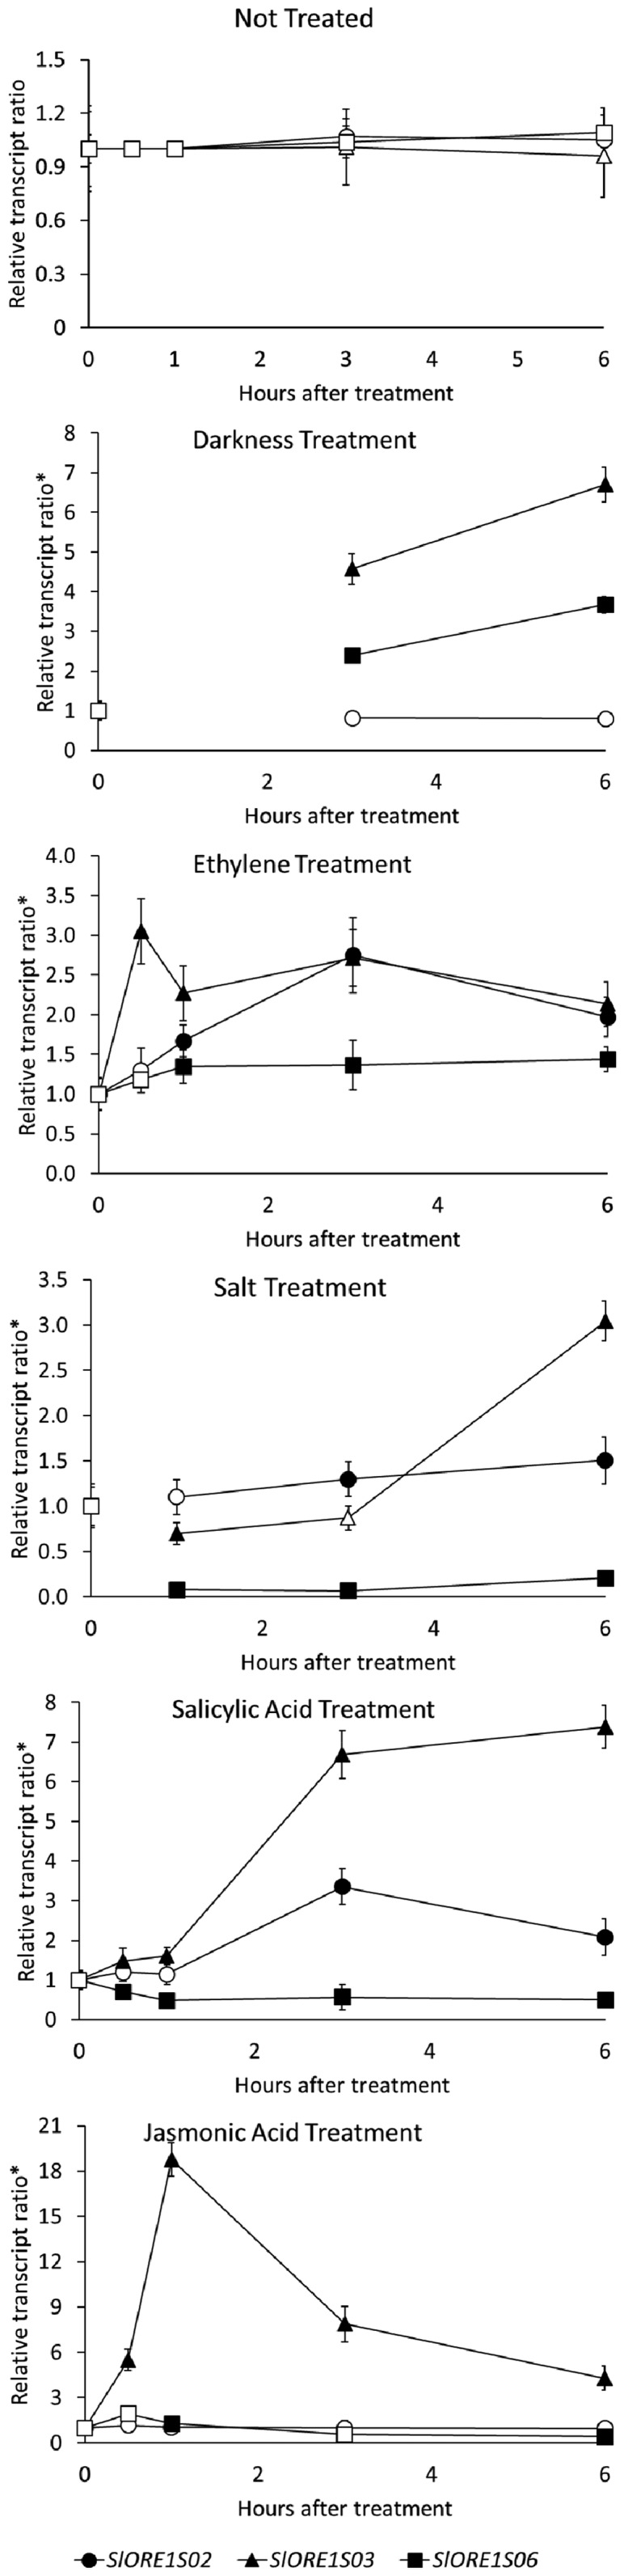
Transcript profiles of SlORE1s in response to senescence-inducing treatments. Transcript profiles are shown for SlORE1s in leaves of 4-week-old in vitro-grown plants after senescence-inducing treatments. Values represent means ± se from at least three biological replicates normalized against the 0-h sample. *, Each treatment relative transcript ratio is expressed as the ratio between the treatment value and the corresponding untreated control. Statistically significant differences relative to the 0-h treatment are represented with black symbols (P < 0.05).