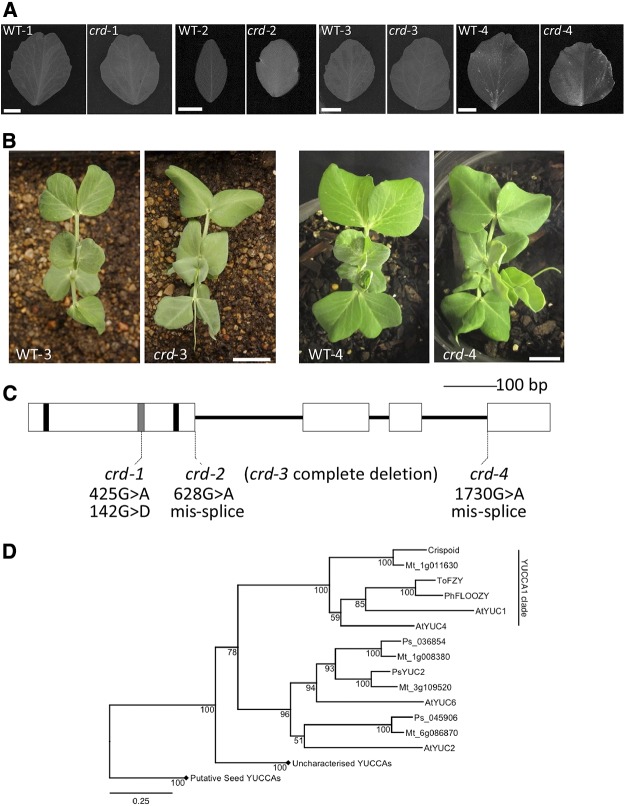
Figure 1.
A, Representative leaflets from node 6 taken from each crd mutant allele and respective wild type. A 1-cm scale marker for each pair is shown in the wild-type image of each pairing. B, Aerial view of seedlings of WT-3 and crd-3 (left) and WT-4 and crd-4 (right) showing node 4 leaves uppermost in each panel. A 2-cm scale marker for each pair of images is shown on the mutant image of each pairing. Similar images or comprehensive phenotypic details of crd-1 and crd-2 seedlings are provided by Swiecicki (1989) and Berdnikov et al. (2000), respectively. C, Diagram of Crd gene showing regions encoding conserved motifs and the positions of crd mutations. Exons are shown as boxes, nucleotides encoding FAD- and NADPH-binding motifs are shown as black bars, ATG-containing motif 1 is shown as a gray bar. D, Phylogenetic analysis of YUCCA protein sequences from M. truncatula (Mt), pea (Ps), and Arabidopsis (At), as well as ToFZY (Solanum lycopersicum) and PhFLOOZY (Petunia hybrida). Bootstrap values (from 1,000 iterations) for this BIONJ tree are displayed adjacent to nodes, and the scale bar indicates genetic distance (0.25 changes/amino acid). Diamonds indicate collapsed clades belonging to the putative but uncharacterized seed YUCCA clades. Accession numbers for all genes are given in Supplemental Table S2.

