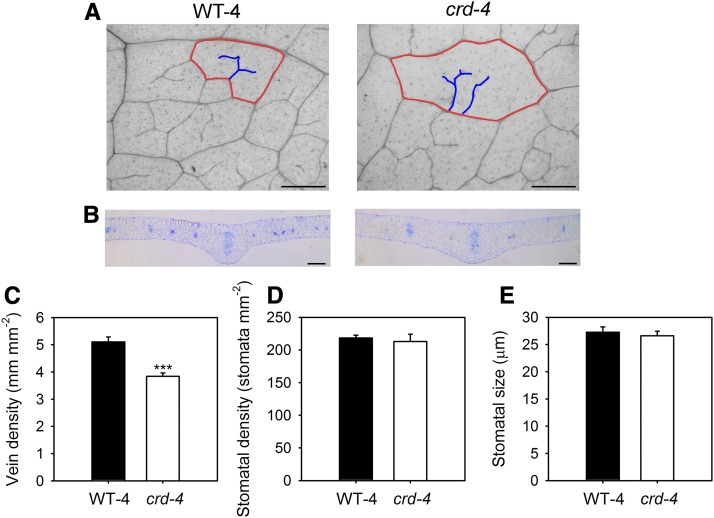
Figure 2.
A, A representative longitudinal image of leaf venation in WT-4 and crd-4 leaves (scale bar = 200 µm, red lines outline an areole, blue lines highlight FEVs within the areole). B, A representative cross-sectional image of WT-4 and crd-4 mutant leaves through the midrib (scale bar = 200 µm). C, Mean vein density (n = 7 leaves, ±se), D, stomatal density (n = 7 leaves, ±se), and E, stomatal size (n = 50 stomata, ±se) in WT-4 and crd-4 mutant plants. Asterisks denote significant difference in means (P < 0.001).

