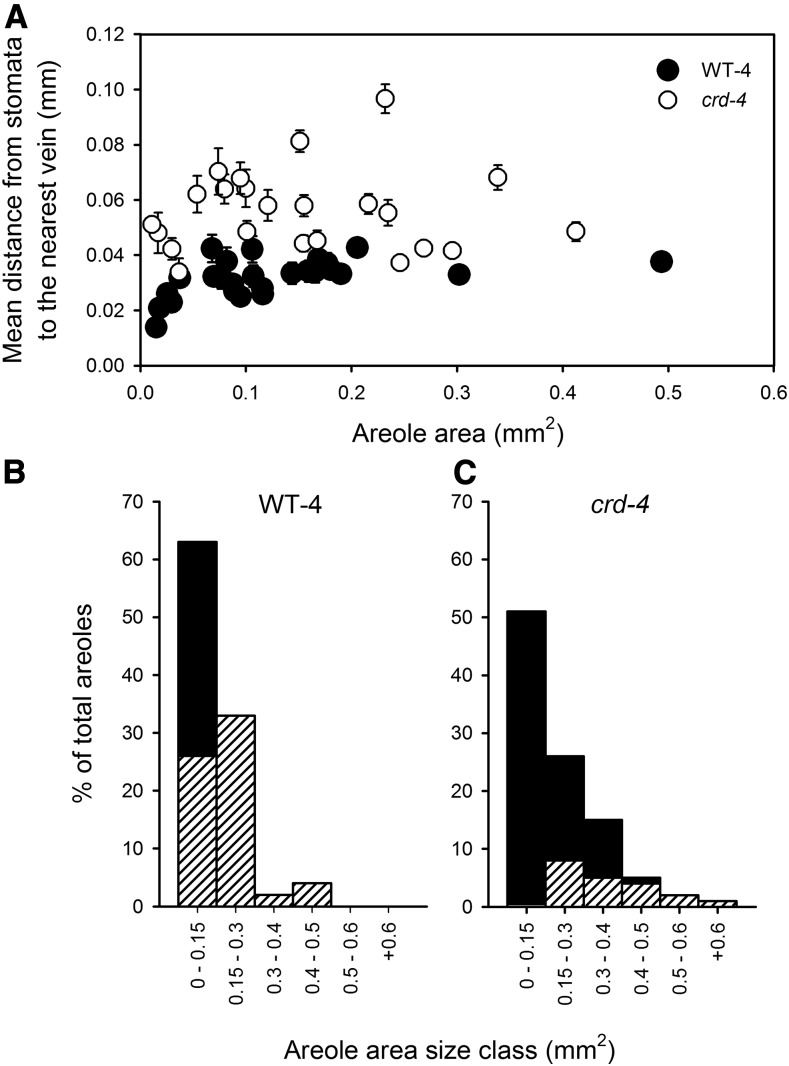
Figure 3.
A, The relationship between the mean distance from stomata to the nearest vein (including FEV) in an areole (±se) and areole area for WT-4 (white circles) and crd-4 mutant (black circles) plants. FEV occurrence across size classes of areoles in WT-4 (B) and crd-4 (C) mutant plants; bars represent the percentage of areoles that fall within each size class, with hatching depicting the areoles in that size class that had FEVs.

