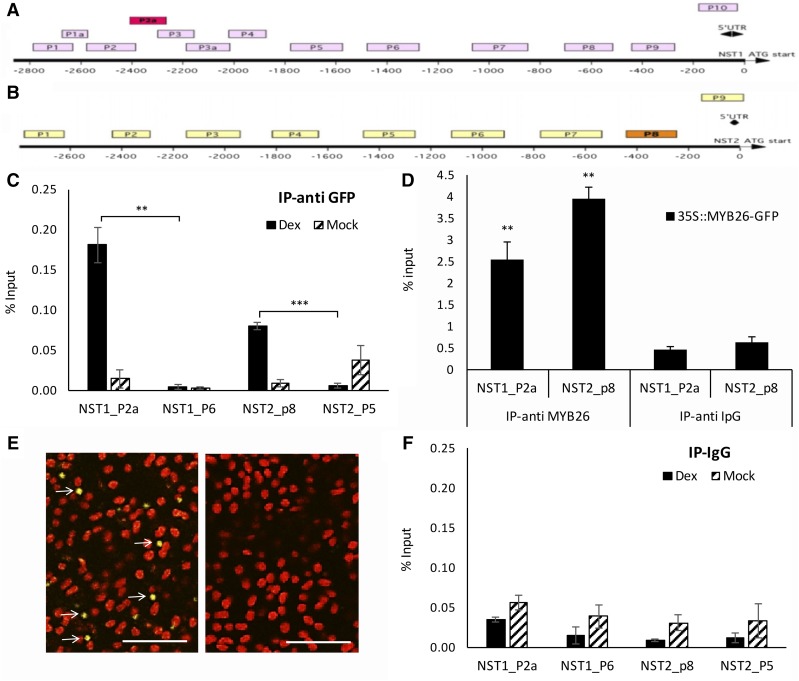
Figure 5.
ChIP indicates that MYB26 directly binds to upstream regions of NST1 and NST2. A and B, Diagram of upstream region of (A) NST1 (B) NST2; boxes P1 to P10 indicate regions used for ChIP analysis; red/orange boxes are regions that showed positive binding. C and D, ChIP qPCR showing enrichment for (C) P2a in NST1 and P8 for NST2 using anti-GFP, and (D) anti-MYB26 antibodies. E, MYB26-YFP within the nucleus of the endothecium (left; arrows) was detected in the DEX-induced MYB26pro:MYB26-GR-YFP line; no nuclear localized expression was seen in the non-DEX-induced line (right). F, No ChIP qPCR enrichment was seen in the IP-ipG controls. Error bars represent sd (t test statistical analysis compared to control primer [C and F] or anti IpG [D] controls; *P ≤ 0.05; **P ≤ 0.01; ***P ≤ 0.001).

