Figure 6.
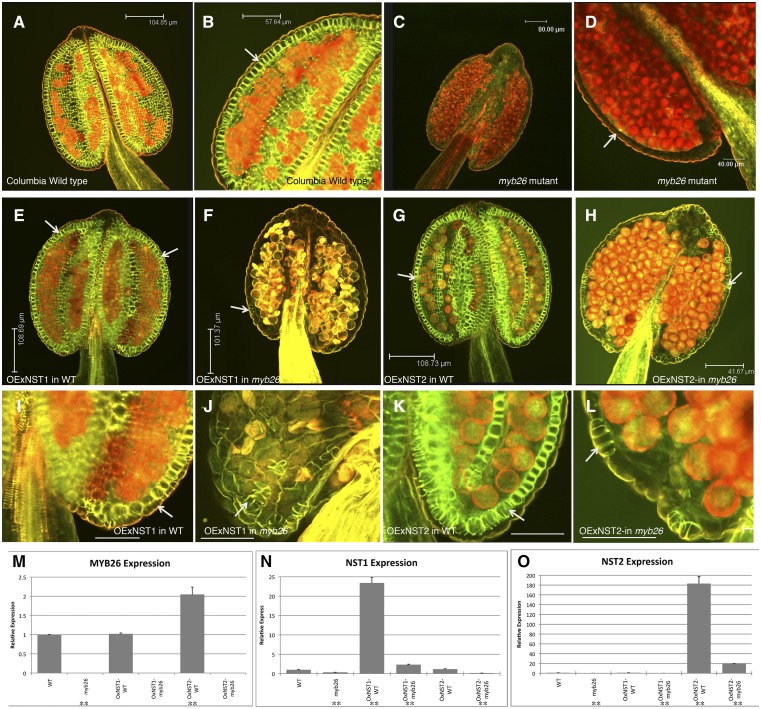
Expression of NST1 or NST2 under the control of the CaMV35S promoter is unable to rescue anther secondary thickening in the myb26 mutant. A to L, Anthers stained for secondary thickening with acridine orange/ethidium bromide and visualized by confocal microscopy. A and B, Wild-type anther showing endothecium thickening (arrow). C and D, myb26 mutant lacking endothecium thickening (arrow). E and I, Overexpression of NST1 (35Spro:NST1) in wild-type background; increased levels of secondary thickening are seen in both the endothecium and epidermal tissues (arrows). F and J, Overexpression of NST1 (35Spro:NST1) in the myb26 mutant background; occasional patches of secondary thickening are seen in the epidermal tissues (arrow), but these are extremely limited, and no endothecium thickening is seen. G and K Overexpression of NST2 (35Spro:NST2) in wild-type background; increased levels of secondary thickening are seen in the endothecium (arrow), but not in the epidermal tissues as seen with NST1 overexpression in wild type. H and L, Overexpression of NST2 (35Spro:NST2) in the myb26 mutant background; occasional patches of secondary thickening are seen in the epidermal cells (arrow); however, these are extremely limited, and the endothecium cells are abnormal and lack the usual expansion seen in these cells prior to secondary thickening deposition. I to L are higher magnifications of the same anther shown in E to H. Scale bars represent 104.85 µm in A, 57.64 µm in B, 80 µm in C, 50 µm in D, 108.69 µm in E, 101.37 µm in F, 108.73 µm in G, 41.67 µm in H, and 50 µm in I to L. M to O, Expression by qRT-PCR analysis in the wild type, myb26 mutant, and overexpression lines of (M) MYB26, (N) NST1, and (O) NST2. Error bars represent sd (t test statistical analysis compared to its relevant background for each line; **P ≤ 0.01).

