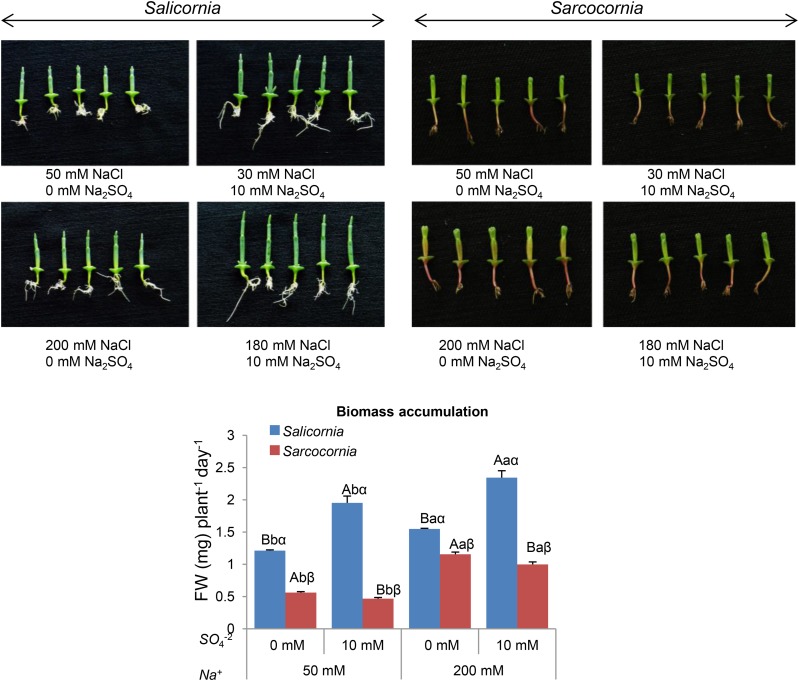
Figure 2.
Effect of sodium (50, 200 mM) and sulfate (0, 10 mM) concentrations on biomass accumulation of Salicornia (left) and Sarcocornia (right). Sulfate is applied as sodium sulfate and the remainder sodium as sodium chloride. The lower and higher salinity treatments are shown in the top and bottom photos, respectively. The values are means ± se (n = 30). Growth of the plants was measured as increase in biomass per day. Values denoted with different letters are significantly different according to the Tukey-Kramer HSD test, P < 0.05 (JMP 8.0 software). Different upper-case letters indicate significant differences between sulfate treatments in Salicornia or Sarcocornia. Different lower-case letters indicate significant differences between salinity treatments in Salicornia or Sarcocornia. Different Greek letters indicate significant difference between Salicornia and Sarcocornia subjected to the same treatment. The data are representative of one of 15 different experiments that yielded similar results.

