Figure 1.
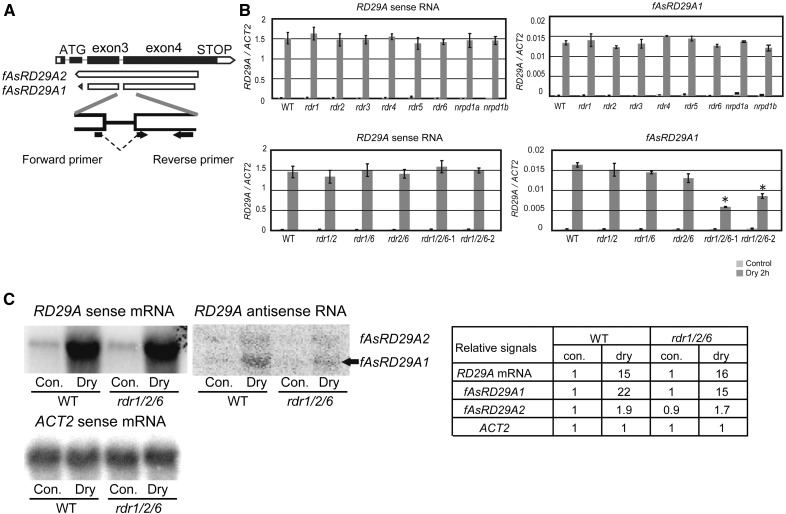
Analysis of the accumulation of sense and antisense RNA at the RD29A locus in rdr and nrpd1 mutants. A, Schematic diagram of two types of antisense RNAs, fAsRD29A1 and fAsRD29A2, that exist at the RD29A locus. In order to detect the accumulation of fAsRD29A1 complementary to the sense RNA, an RD29A forward primer containing part of exon 3 and 4, but lacking the intron, was used for qRT-PCR. B, The accumulation level of RD29A sense RNA and antisense RNA (fAsRD29A1) in wild type, single mutants of six RDRs, NRPD1a, and NRPD1b, and double and triple mutants of RDR1/2/6 was measured by qRT-PCR. One μg of total RNA was used. Data represent the mean ± SD (n = 3). Asterisk indicates the P values for t test < 0.01, when mutants and wild type were compared under the same condition. C, northern analysis of RD29A sense RNA and antisense RNAs in wild-type and rdr1/2/6-1 plants. Ten μg of total RNA was loaded into each lane and hybridized with RI-labeled strand-specific RNA probes of RD29A and the ACT2 control (that shows the similar expression level between nontreatment and 2 h drought treatment). The exposure times for detecting the sense- and antisense- RNAs were 1 h and 24 h, respectively. The fAsRD29A1 fragment is indicated by an arrow. The table shows relative RI-intensities of each band at the northern blots using Image-J program.

