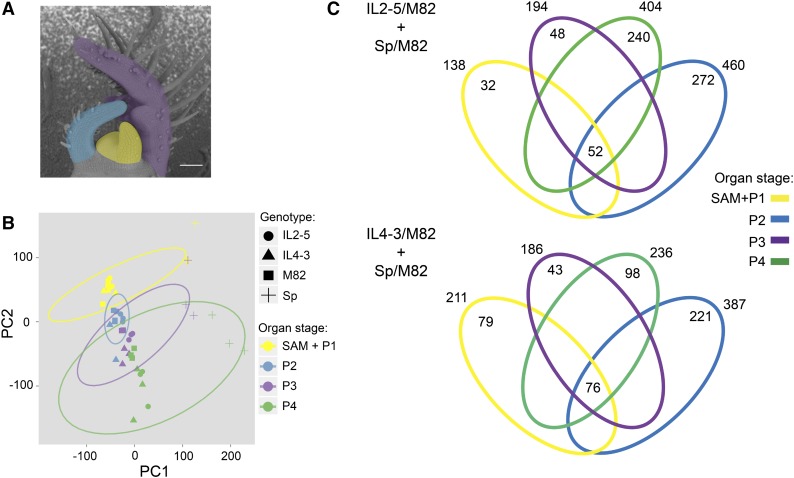
Figure 5.
Comparative transcriptomics of leaf development in two thick ILs and their parents. A, Successive stages of leaf development (plastochrons P1–P4 colored as in the legend to B) were dissected from M82, S. pennellii (Sp), and thick IL2-5 and IL4-3. B, Principal component analysis of normalized RNA-Seq read counts. C, Venn diagrams (not to scale) depict an overview of DEGs (q < 0.05) that are shared in each IL and the S. pennellii parent relative to M82. The number of DEGs unique to each organ is shown within the ellipses, and those common to all organs are shown in the center. The total number of DEGs at each plastochron stage is shown outside the ellipses.

