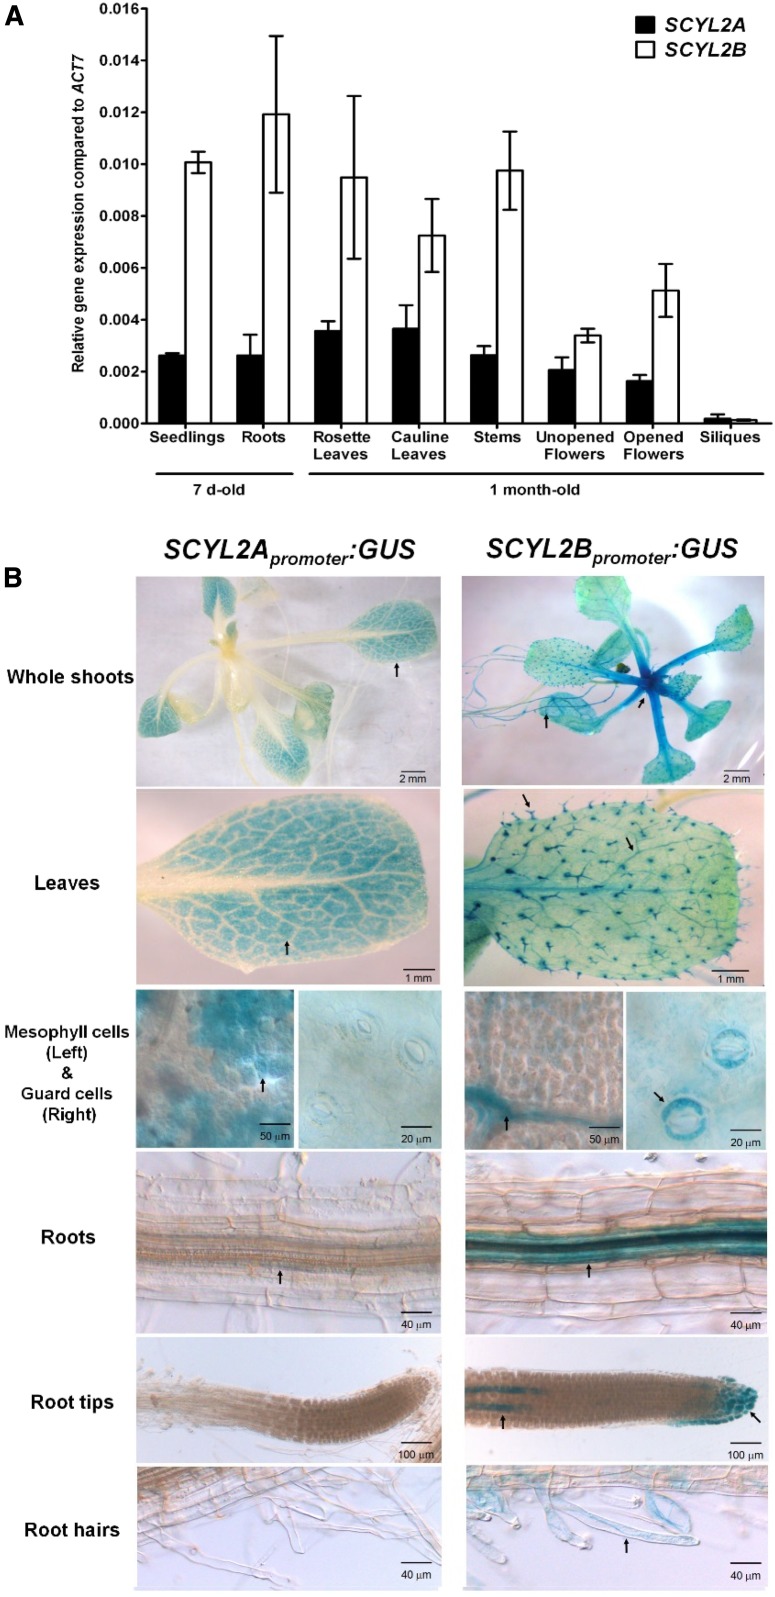
Figure 5.
SCYL2A and SCYL2B expression levels in various tissues. A, Quantitative real-time PCR analysis of SCYL2A and SCYL2B expression in various tissues. Tissues from 7-d-old plants and 1-month-old plants were used in this analysis. The levels of SCYL2A and SCYL2B transcripts were normalized to ACTIN7. Three biological replicates were used, and error bars represent se. B, Spatial localization of SCYL2A and SCYL2B. Histochemical localization is shown for GUS activity in plants carrying SCYL2Apromoter:GUS (left) and SCYL2Bpromoter:GUS (right). About 2-week-old plants grown on plates were used for the visualization of GUS activity. Arrows indicate GUS staining.

