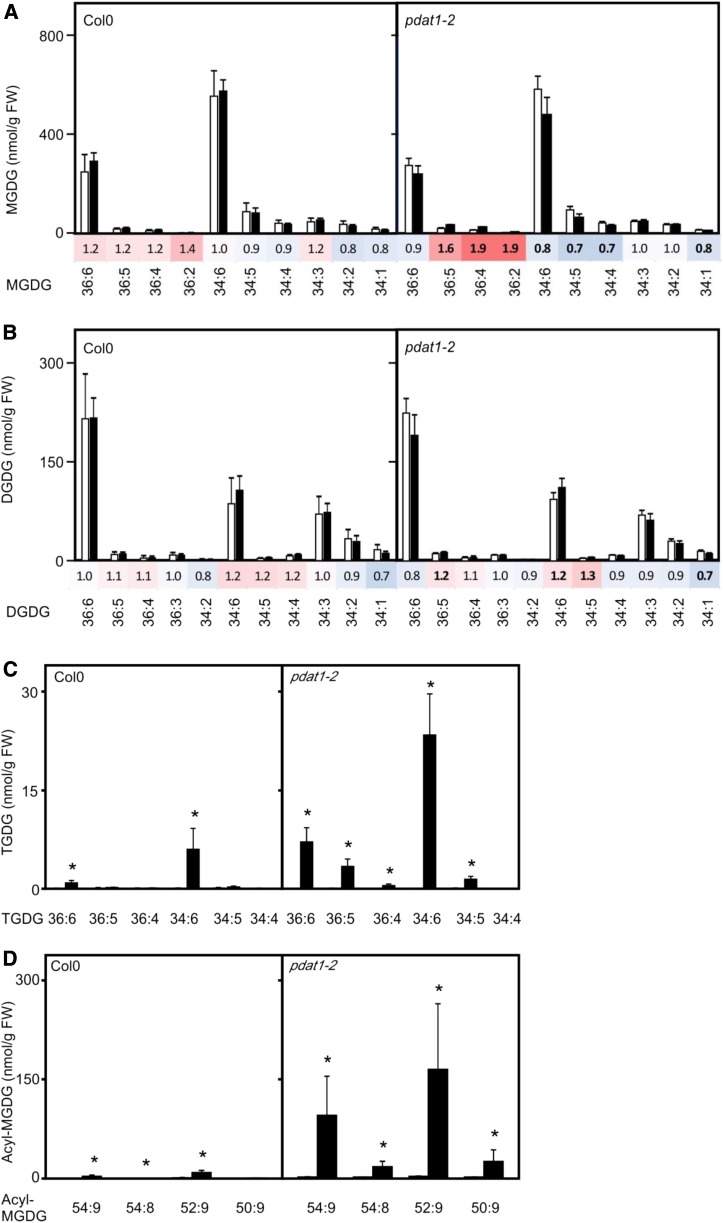
Figure 5.
Heat-induced changes of TGDGs and acyl-MGDGs in wild-type and pdat1-2 seedlings. Levels of MGDGs (A), DGDGs (B), TGDGs (C), and acyl-MGDGs (D) were very low in 2-week-old seedlings kept at 22°C (white bars) and after a heat shock (45°C for 90 min, black bars). Data represent means ± sd, n = 4. Heat maps (A and B) display the fold changes of lipid species after the heat shock compared to control seedlings at 22°C; statistical significant changes of lipid levels (P < 0.05) are indicated by bold numbers. Asterisks in C and D denote statistically significant differences (P < 0.05) from 22°C. FW, Fresh weight.

