Figure 5.
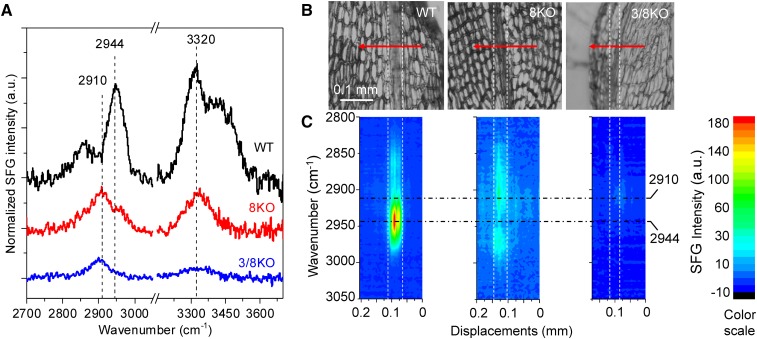
SFG spectroscopy of P. patens leaves. A, Full SFG spectra collected from leaf midribs (each is the average of nine spectra from three different positions on each of three different leaves). A strong peak in the CH stretch region (2,944 cm−1) is present in spectra from the wild type (WT), greatly diminished in spectra from ppcesa8KO (8KO), and absent in spectra from ppcesa3/8KO (3/8KO). B, P. patens wild type, ppcesa8KO, and ppcesa3/8KO leaves with SFG scan trajectories traversing the midribs. Step size was 5 μm per step. SFG spectra were collected from 2,850 to 3,150 cm−1, covering the entire CH region. C, 2D projection image of SFG spectra collected across the midribs of each leaf shown in B. Each column in each image is an entire spectrum collected from one point plotted against displacement along the scan trajectory. Colors indicate SFG intensity as shown in the scale at right.

