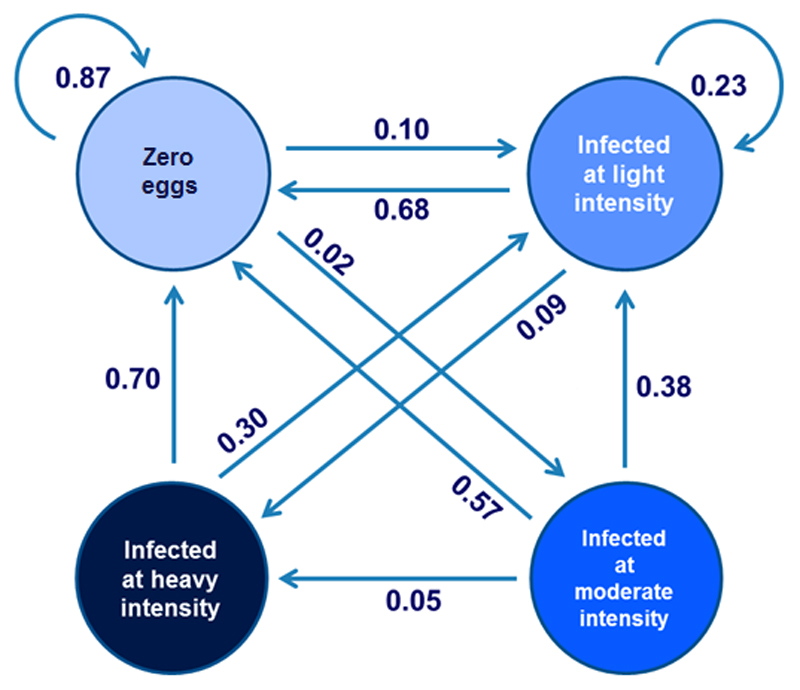
Figure 1.
Graphical representation of the Markov Model applied to hookworm infection data from Vietnam. The circles represent the four possible condition states (CS) and arrows represent the transition probabilities (TP) from one CS to another during one year of intervention.
For example in the case of individuals with “zero eggs” after the first year of intervention 87% of them remain not-infected, 10% became infected at light intensity and 2% became infected at moderate intensity.

