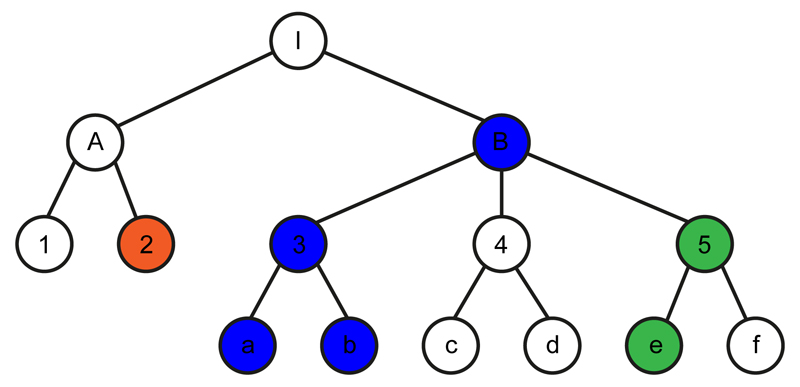
Figure 1. Schematic of diagnosis classification tree and genetic coefficient transition scenarios tested.
Each node in the tree represents a clinical diagnosis and nodes are ordered in a hierarchical structure based on a classification criterion (such as similarities in clinical manifestations). White nodes represent the null state whereby there is no genetic association with the clinical phenotype. Green, red and blue nodes represent the alternative state whereby there is a genetic association with the clinical phenotype, with the different colours corresponding to different, uncorrelated genetic coefficients of association. A genetic coefficient can transition from the null state to a non-zero coefficient as in the I→B and A→2 pairs. From the non-zero state a genetic coefficient can remain in a correlated non-zero state (as in the B→3, 3→a, 3→b and 5→e pairs); it can transition back to the null state (as in the B→ 4 and 5→f pairs); or it can transition to a new, uncorrelated non-zero state (as in the B→5 pair). An in-depth description of the method is provided in the Supplementary Note.

