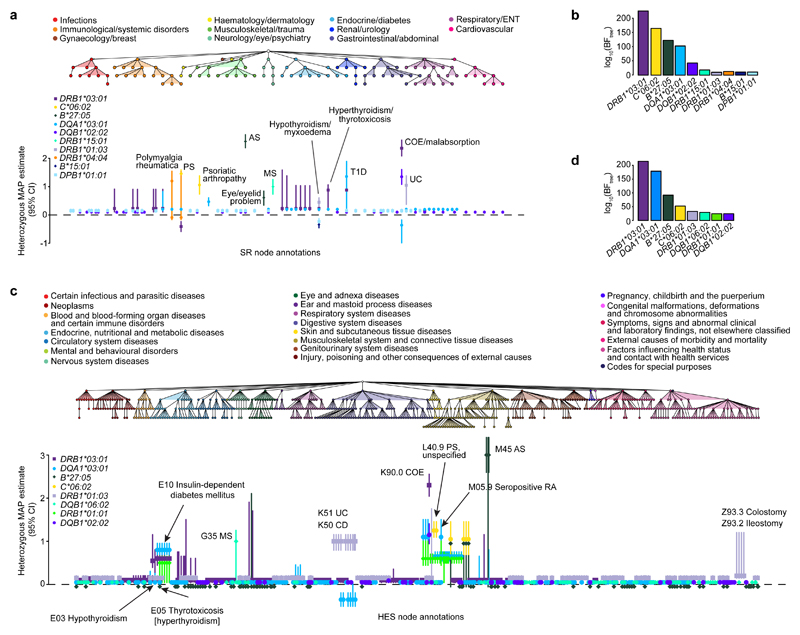
Figure 4. Genetic analysis of HLA allelic variation in the risk of clinical phenotypes from the UK Biobank SR diagnosis and HES datasets.
a, The tree depicts the hierarchical structure of self-reported clinical phenotypes as determined by the UK Biobank classification. Only nodes with a significant association (PP > 0.75) with at least one HLA allele are shown, along with their parent nodes. The graph shows estimated effect sizes for the heterozygous genotype of the different HLA alleles on susceptibility to each clinical phenotype. Bars show the 95% credible interval. b, Evidence of association for each HLA allele with at least one node in the tree (BFtree) in the conditional TreeWAS analysis for the SR dataset (Supplementary Table 9). c, The tree depicts the hierarchical structure of HES-derived clinical phenotypes as determined by the ICD-10 classification (showing nodes with PP > 0.75 and their parent nodes). The graph shows estimated effect sizes for the heterozygous genotype of the different HLA alleles on susceptibility to each clinical phenotype. d, Evidence of association for each HLA allele with at least one node in the tree in the conditional TreeWAS analysis using the HES data (Supplementary Table 10). Estimates for heterozygous and homozygous genotype effect sizes and descriptions of all phenotypes shown are available in Supplementary Tables 2 and 3. AS, ankylosing spondylitis; CI, confidence interval; COE, coeliac disease; ENT, ear, nose, throat; MAP, maximum a posteriori; MS, multiple sclerosis; PS, psoriasis; RA, rheumatoid arthritis; T1D, type 1 diabetes; UC, ulcerative colitis.

