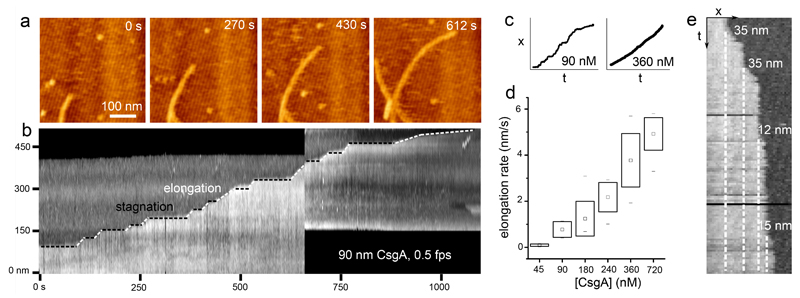
Figure 3. Curli display stop-and-go growth kinetics.
(a) High-speed time lapse imaging of a single growing fiber terminus (still images are frames of Supporting Video 3); (b) kymograph constructed from the fiber terminus followed in the upper panel reveals the stop-and-go dynamics of fiber growth; (c) representative traces of the fiber terminus location as a function of time at low and high CsgA concentration; (d) box-plot of the observed fiber elongation rate (robs, i.e. the global fiber elongation rate composed of periods of stagnation and burst elongation) averaged over 10 different fibers per concentration (box range = sample standard deviation; □ = sample mean; dashes show the minima and maxima of the dataset); (e) kymograph constructed from high speed AFM imaging at 45 nM CsgA shows the typical minimal detectable size of the fiber end displacements of 12±4 nm (mean elongation rate is 0.1±0.05 nm/s (see panel d); time-resolution: 10s). Figures (a), (b) and (e) correspond to the AFM error channel.

