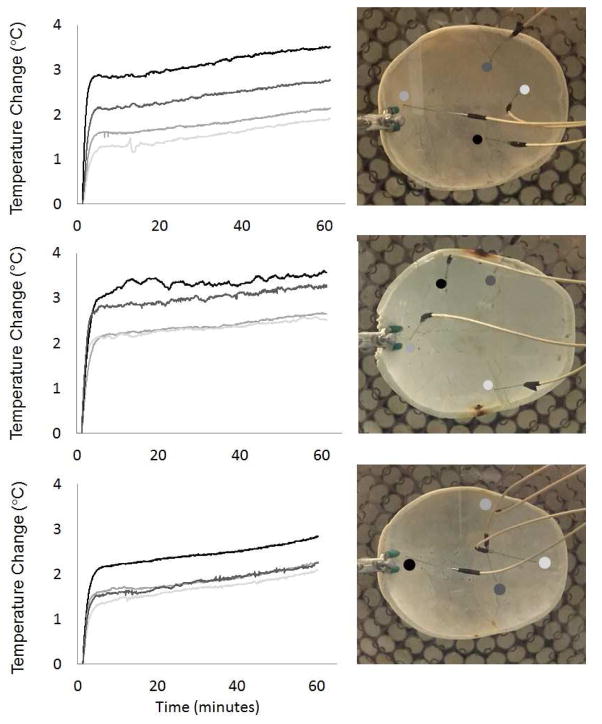
Figure 10. Skullcap Temperature Monitoring.
The change in temperature in each skullcap monitored at different locations while applying treatment with the 500 kHz array at a PRF of 200 Hz. For each skullcap, the maximum temperature rise remained less than 4 °C. The temperature rise measured by different probes in the skullcaps showed a variation in temperature based on the location of the probe. For skullcaps 1 – 3, the probe measurements varied between 1.9 and 3.5, 2.5 and 3.6 and 2.1 and 2.8 °C, respectively.

